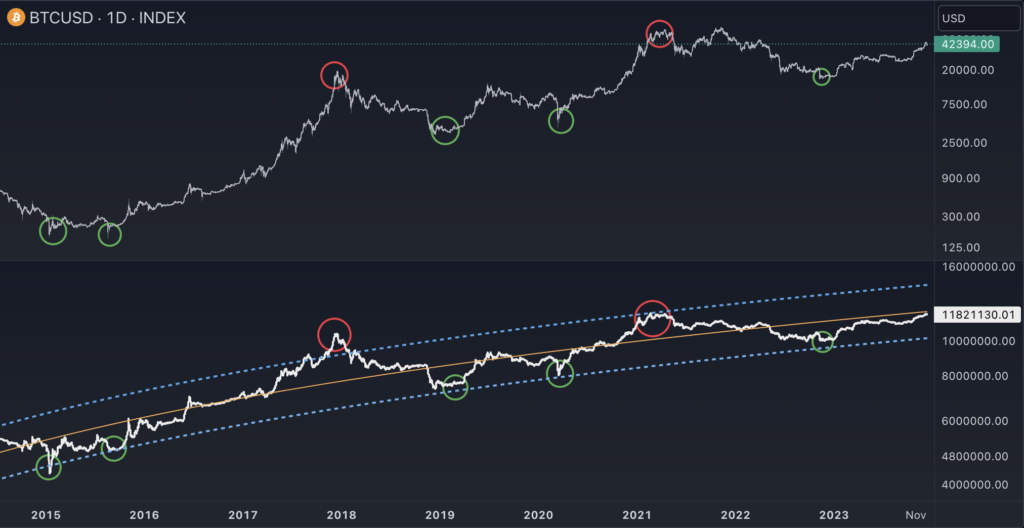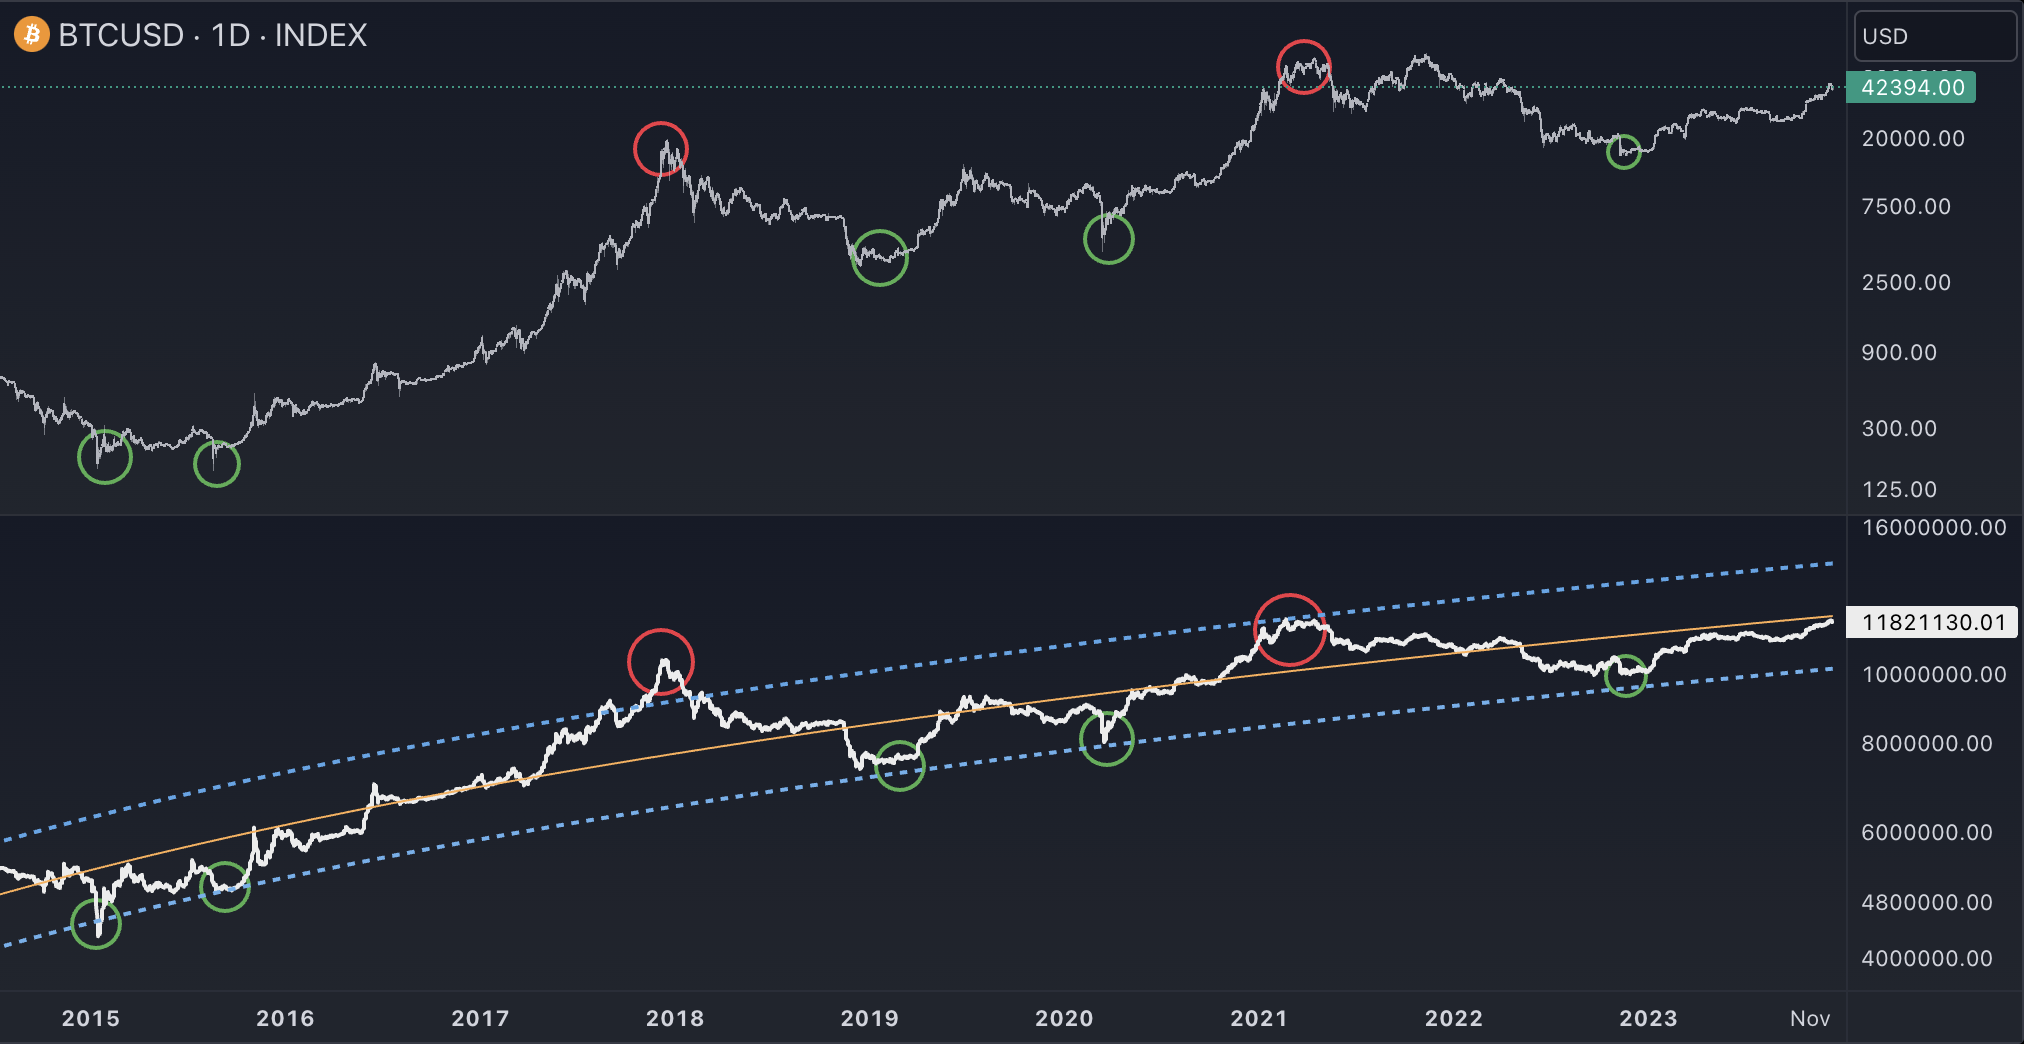
- เทคนิคที่ใช้:
- วิเคราะห์ปริมาณการซื้อขายสะสมเฉพาะของ Bitcoin
- พิจารณาว่าราคาปิดสูงกว่าราคาเปิดหรือไม่ในช่วงเวลาที่กำหนด และเพิ่มหรือลดปริมาณการซื้อขายตามนั้น
- ให้ข้อมูลเชิงลึกเกี่ยวกับปริมาณการซื้อขายรวมและวิเคราะห์ความสัมพันธ์ระหว่างปริมาณการซื้อขายกับการเคลื่อนไหวของมูลค่า BTC
- สัญญาณซื้อเกิดเมื่อ:
- มีจุดต่ำสุดในปริมาณการซื้อขายสะสม ซึ่งอาจบ่งบอกถึงจุดต่ำสุดของตลาดและเป็นช่วงของการซื้อขายที่ลดลงหรือการรวมตัวของราคา
- เมื่อมีการสูญเสียความสนใจและความเชื่อมั่นในตลาด cryptocurrency และปริมาณการซื้อขายลดลง ซึ่งอาจเป็นช่วงเวลาที่ดีที่สุดในการซื้อ
- สัญญาณขายเกิดเมื่อ:
- มีจุดสูงสุดในปริมาณการซื้อขายสะสม ซึ่งอาจบ่งบอกถึงจุดสูงสุดของตลาดและเป็นช่วงของการซื้อขายที่เข้มข้น
- ใช้งานในโปรแกรม TradingView https://www.tradingview.com/?aff_id=134641
- เปิดบัญชีทดลอง: การเริ่มต้นของ Passive Income https://bit.ly/3Sdkir2
//@version=5
indicator("Cumulative Volume Value (BTC)", "CVV [BTC]",overlay=false, max_lines_count = 500)

//Cumulative Volume
int length = input(1, "Cumulative Volume Length", group = "Cumulative Volume Settings")
vzo = volume
vzo := close > open[length]
             ? volume : -volume
vzo:= ta.cum(vzo)

// Log Regression Channel
f_loglog_regression_from_arrays(_time_array, _price_array) =>
    int _size_y = array.size(_price_array)
    int _size_x = array.size(_time_array)
    float[] _y_array = array.new_float(_size_y)
    float[] _x_array = array.new_float(_size_x)

    for _i = 0 to _size_y - 1
        array.set(_y_array, _i, math.log(array.get(_price_array, _i)))
        array.set(_x_array, _i, math.log(array.get(_time_array, _i)))

    float _sum_x = array.sum(_x_array)
    float _sum_y = array.sum(_y_array)
    float _sum_xy = 0.0
    float _sum_x2 = 0.0
    float _sum_y2 = 0.0

    if _size_y == _size_x
        for _i = 0 to _size_y - 1
            float _x_i = nz(array.get(_x_array, _i))
            float _y_i = nz(array.get(_y_array, _i))
            _sum_xy := _sum_xy + _x_i * _y_i
            _sum_x2 := _sum_x2 + math.pow(_x_i, 2)
            _sum_y2 := _sum_y2 + math.pow(_y_i, 2)
            _sum_y2

    float _a = (_sum_y * _sum_x2 - _sum_x * _sum_xy) / (_size_x * _sum_x2 - math.pow(_sum_x, 2))
    float _b = (_size_x * _sum_xy - _sum_x * _sum_y) / (_size_x * _sum_x2 - math.pow(_sum_x, 2))

    float[] _f = array.new_float()

    for _i = 0 to _size_y - 1
        float _vector = _a + _b * array.get(_x_array, _i)
        array.push(_f, _vector)

    _slope = (array.get(_f, 0) - array.get(_f, _size_y - 1)) / (array.get(_x_array, 0) - array.get(_x_array, _size_x - 1))
    _y_mean = array.avg(_y_array)

    float _SS_res = 0.0
    float _SS_tot = 0.0

    for _i = 0 to _size_y - 1
        float _f_i = array.get(_f, _i)
        float _y_i = array.get(_y_array, _i)
        _SS_res := _SS_res + math.pow(_f_i - _y_i, 2)
        _SS_tot := _SS_tot + math.pow(_y_mean - _y_i, 2)
        _SS_tot

    _r_sq = 1 - _SS_res / _SS_tot

    float _sq_err_sum = 0

    for _i = 0 to _size_y - 1
        _sq_err_sum += math.pow(array.get(_f, _i) - array.get(_y_array, _i), 2)

    _dev = math.sqrt(_sq_err_sum / _size_y)

    [_f, _slope, _r_sq, _dev]

src = vzo
n = input(3500, title='Length', group = "Regression Channel Settings")
mult = input(2.000, title='dev mult')

var float[] price_array = array.new_float(n)
var int[] x_array = array.new_int(n)

array.unshift(price_array, src)
array.pop(price_array)
array.unshift(x_array, bar_index)
array.pop(x_array)

var line[] reg_line_array = array.new_line()
var line[] dev_up_line_array = array.new_line()
var line[] dev_dn_line_array = array.new_line()

var label r2_label = label.new(x = na, y = na, style = label.style_label_lower_left, color = #00000000, textcolor = color.blue, size=size.normal, textalign = text.align_left)

float[] dev_up_array = array.new_float()
float[] dev_dn_array = array.new_float()

var int step = na
var int line_n = na

if barstate.isfirst
    line_n := math.min(n, 250)
    for i = 0 to line_n - 1
        array.unshift(reg_line_array, line.new(x1=na, y1=na, x2=na, y2=na, color=color.rgb(255, 174, 82)))
    if n > 250
        step := math.ceil(n / 250)
    else
        step := 1
    for i = 0 to math.floor(line_n / 2) - 1
        array.unshift(dev_up_line_array, line.new(x1=na, y1=na, x2=na, y2=na, color=color.rgb(84, 166, 233), width = 2))
        array.unshift(dev_dn_line_array, line.new(x1=na, y1=na, x2=na, y2=na, color=color.rgb(103, 177, 238), width = 2))

if barstate.islast
    [predictions, slope, r_sq, dev] = f_loglog_regression_from_arrays(x_array, price_array)

    for i = 0 to array.size(predictions) - 1
        array.push(dev_up_array, math.exp(array.get(predictions, i) + mult * dev))
        array.push(dev_dn_array, math.exp(array.get(predictions, i) - mult * dev))

    for i = 0 to array.size(predictions) - 2 - step by step
        line.set_xy1(array.get(reg_line_array, i / step), x=bar_index - i, y=math.exp(array.get(predictions, i)))
        line.set_xy2(array.get(reg_line_array, i / step), x=bar_index - i - step, y=math.exp(array.get(predictions, i + step)))

    for i = 0 to array.size(dev_up_array) - 2 - step by step * 2
        line.set_xy1(array.get(dev_up_line_array, i / (step * 2)), x=bar_index - i, y=array.get(dev_up_array, i))
        line.set_xy2(array.get(dev_up_line_array, i / (step * 2)), x=bar_index - i - step, y=array.get(dev_up_array, i + step))
        line.set_xy1(array.get(dev_dn_line_array, i / (step * 2)), x=bar_index - i, y=array.get(dev_dn_array, i))
        line.set_xy2(array.get(dev_dn_line_array, i / (step * 2)), x=bar_index - i - step, y=array.get(dev_dn_array, i + step))


plot(vzo, color = color.rgb(236, 236, 236), linewidth = 2)
https://www.tradingview.com/script/7qL8SHiM-Cumulative-Volume-Value-BTC/
