
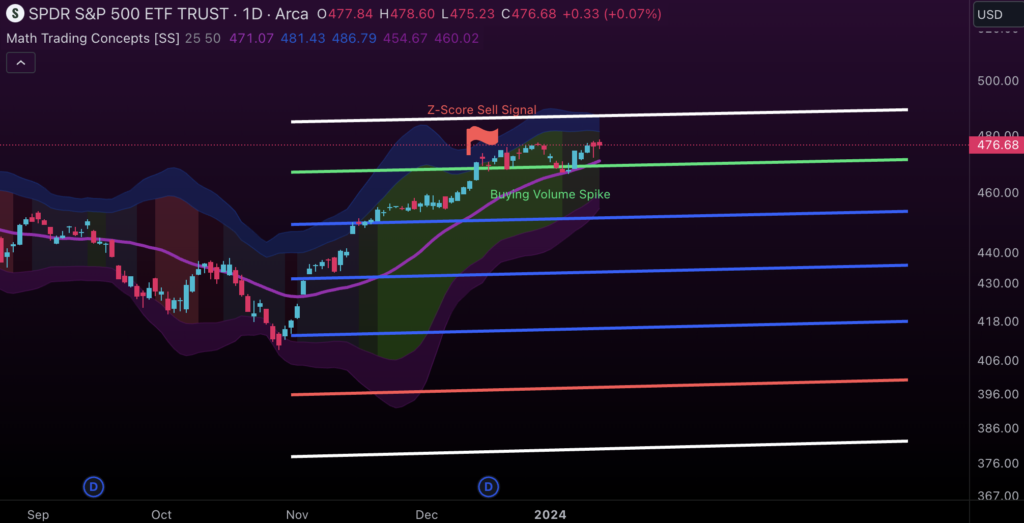
- เทคนิคที่ใช้:
- ใช้งานปริมาณการซื้อขาย (Volume) แปลงเป็น Z-Score ภายในช่วงเวลาที่กำหนด
- ใช้ Z-Score เพื่อสร้างเมฆที่แสดงพารามิเตอร์ของการเบี่ยงเบนมาตรฐาน
- ใช้การพยากรณ์แบบอัตโนมัติ (Autoregressive Forecasting) สำหรับการคาดการณ์แนวโน้ม
- ใช้ ANOVA (Analysis of Variance) เพื่อวัดความแตกต่างของค่าเฉลี่ยและสัญญาณการเปลี่ยนแปลงที่สำคัญ
- สัญญาณซื้อเกิดเมื่อ:
- Z-Score ของปริมาณการซื้อขายเกิน 2
- พื้นที่การกลับตัวของ Z-Score ในอดีตบ่งบอกถึงการซื้อ
- ANOVA แสดงค่าทางสถิติที่มีนัยสำคัญก่อนเกิดจุดกลับตัวหรือการแตกต่างของแนวโน้ม
- สัญญาณขายเกิดเมื่อ:
- Z-Score ของปริมาณการขายต่ำกว่า -2
- พื้นที่การกลับตัวของ Z-Score ในอดีตบ่งบอกถึงการขาย
- ANOVA แสดงค่าทางสถิติที่มีนัยสำคัญก่อนเกิดจุดกลับตัวหรือการแตกต่างของแนวโน้ม
- ใช้งานในโปรแกรม TradingView https://www.tradingview.com/?aff_id=134641
- เปิดบัญชีทดลอง: การเริ่มต้นของ Passive Income https://bit.ly/3Sdkir2
// This source code is subject to the terms of the Mozilla Public License 2.0 at https://mozilla.org/MPL/2.0/
//  /$$$$$$   /$$                                                         /$$
// /$$__  $$ | $$                                                        | $$
//| $$  \__//$$$$$$    /$$$$$$  /$$    /$$ /$$$$$$   /$$$$$$   /$$$$$$$ /$$$$$$    /$$$$$$  /$$    /$$ /$$$$$$   /$$$$$$$
//|  $$$$$$|_  $$_/   /$$__  $$|  $$  /$$//$$__  $$ /$$__  $$ /$$_____/|_  $$_/   /$$__  $$|  $$  /$$//$$__  $$ /$$_____/
// \____  $$ | $$    | $$$$$$$$ \  $$/$$/| $$$$$$$$| $$  \__/|  $$$$$$   | $$    | $$$$$$$$ \  $$/$$/| $$$$$$$$|  $$$$$$
// /$$  \ $$ | $$ /$$| $$_____/  \  $$$/ | $$_____/| $$       \____  $$  | $$ /$$| $$_____/  \  $$$/ | $$_____/ \____  $$
//|  $$$$$$/ |  $$$$/|  $$$$$$$   \  $/  |  $$$$$$$| $$       /$$$$$$$/  |  $$$$/|  $$$$$$$   \  $/  |  $$$$$$$ /$$$$$$$/
// \______/   \___/   \_______/    \_/    \_______/|__/      |_______/    \___/   \_______/    \_/    \_______/|_______/

//       ___________________
//      /                   \
//     /  _____        _____ \
//    /  /     \      /     \  \
// __/__/       \____/       \__\_____
//|           ___________           ____|
// \_________/           \_________/
//            \  /////// /
//             \/////////
// © Steversteves
//@version=5
indicator("Math Trading Concepts [SS]", max_bars_back = 1000, overlay=true)
import Steversteves/Forecasting/3 as forecast
import Steversteves/SPTS_StatsPakLib/4 as spts
import HeWhoMustNotBeNamed/arrays/1 as arrays

// groups
g1 = "Z-Score"
g2 = "Forecasting"
g3 = "Volume"
g4 = "Trend"
z_len =         input.int(14, "Z-Score Length", group = g1)
pltsma =        input.bool(true, "Plot SMA of Z", group = g1)
fore =          input.bool(false, "Plot Forecast", group = g2)
forelen =       input.int(14, "Forecast Length", group = g2)
pltvol =        input.bool(true, "Show Volume Alerts", group = g3)
pltanova =      input.bool(true, "Show ANOVA Alerts", group = g4)
plttrend =      input.bool(true, "Plot Trend Fills", group = g4)
plotreg =       input.bool(false, "Plot Linear Regression Channel based on Trend", group = g4)

// Auto Trend Detect
forecast_hi_length = forecast.auto_trend_lookback_value(high)
forecast_lo_length =  forecast.auto_trend_lookback_value(low)
forecast_cl_length = forecast.auto_trend_lookback_value(close)

// Z Bands
hi_avg = ta.sma(high, z_len)
lo_avg = ta.sma(low, z_len)
cl_avg = ta.sma(close, z_len)

z_avg = (hi_avg + lo_avg + cl_avg) / 3

hi_sd = ta.stdev(high, z_len)
lo_sd = ta.stdev(low, z_len)
cl_sd = ta.stdev(close, z_len)

z_sd = (hi_sd + lo_sd + cl_sd) / 3

current_value = (high + low + close) / 3

z = (current_value - z_avg) / z_sd

zma = ta.sma(close, z_len)
plot(pltsma ? zma : na, "Z SMA", color = color.purple, linewidth = 3)
z_lcl_cloud = (z_avg) + (-3 * z_sd)
z_lcl2_cloud = (z_avg) + (-2 * z_sd)

z_ucl_cloud = (z_avg) + (2* z_sd)
z_ucl2_cloud = (z_avg) + (3 * z_sd)

// Z Colours
color upper_z = color.new(color.rgb(12, 87, 207), 75)
color lower_z = color.new(color.rgb(137, 16, 148), 75)

a = plot(z_ucl_cloud, color = upper_z)
b = plot(z_ucl2_cloud, color = upper_z)
c = plot(z_lcl_cloud, color = lower_z)
d = plot(z_lcl2_cloud, color = lower_z)
fill(a, b, color = upper_z)
fill(c, d, color = lower_z)

// Trend Identifcation

trend = ta.correlation(time, close, 25)
trend_identification(value) =>
    color trend_col = na
    if value >= 0.5 and value < 0.8
        trend_col := color.new(color.rgb(71, 189, 32), 85)
    else if value >= 0.8
        trend_col := color.new(color.rgb(63, 252, 0), 80)
    else if value <= -0.5 and value > -0.8
        trend_col := color.new(color.rgb(89, 11, 16), 85)
    else if value <= -0.8
        trend_col := color.new(color.red, 80)
    else
        trend_col := color.new(color.rgb(123, 176, 186), 90)

fill(a, d, color = plttrend ? trend_identification(trend) : na)
atr_avg = ta.atr(10)
// Breakout Detection ANOVA
transp = color.new(color.white, 100)
[sig, ANOVA] = spts.ANOVA(high[1], low[1], close[1], 14)

var int anova_wait = 0

if ANOVA >= 6.52 and ANOVA <= 6.52 + 1 and pltanova
    anova_wait += 1
    if anova_wait >= 5
        label.new(bar_index, low - atr_avg, text = "Breakout/Reversal, \n ANOVA:" + str.tostring(math.round(ANOVA,2)), color = transp, textcolor = color.orange, style = label.style_label_up)
        anova_wait := 0

quatratic_autoregressve_ts(src, train, forecast_length) =>
    // Autoregrssion of Source
    [a_result, a_pear_cor, a_rsqrd, a_std_err, slope, intercept] = spts.f_linear_regression(src, src[1], train)
    float auto_predict = (src * slope) + intercept
    autoreg_array = array.new<float>()
    for i = 0 to forecast_length
        autoreg_array.push(auto_predict)
        auto_predict := (auto_predict * slope) + intercept

    [result, pear_cor, rsqrd, std_err, b1, b2, b0] = spts.f_multiple_regression(src, time, src[1], time, src[1], train)

    float forecast_result = (time * b1) + (src[1] * b2) + b0
    forecast_array = array.new<float>()
    for i = 0 to forecast_length
        forecast_array.push(forecast_result[i])
        forecast_result := (b1 * (time + (timeframe.in_seconds() * 1000 * 1 + i)) + (b2 * array.get(autoreg_array, i)) + b0)
    forecast_array

hi_res = quatratic_autoregressve_ts(high, forecast_hi_length, forelen - 1)
lo_res = quatratic_autoregressve_ts(low, forecast_lo_length, forelen - 1)


hibox_arr = array.new<float>()
lobox_arr = array.new<float>()

for i = 0 to array.size(hi_res) - 1
    arrays.push(hibox_arr, array.get(hi_res, i), forelen + 1)
    arrays.push(lobox_arr, array.get(lo_res, i), forelen + 1)

if barstate.islast and fore
    for i = 0 to array.size(hi_res) - 1
        box.new(bar_index + 1 + i, array.get(hibox_arr, i), bar_index + 2 + i, array.get(lobox_arr, i), border_color = color.white, bgcolor = color.blue)
// END OF FORECAST
// Volume Analytics

buy_vol = request.security(syminfo.tickerid, "", close > open ? (volume - ta.sma(volume, z_len)) / ta.stdev(volume, z_len) : na, lookahead = barmerge.lookahead_on)
sell_vol = request.security(syminfo.tickerid, "", close < open ? (volume - ta.sma(volume, z_len)) / ta.stdev(volume, z_len) : na, lookahead = barmerge.lookahead_on)

bool buy_spike = buy_vol >= 2 or buy_vol <= -2
bool sell_spike = sell_vol >= 2 or sell_vol <= -2
var buy_wait = 0
var sell_wait = 0
if buy_spike and pltvol
    buy_wait += 1
    if buy_wait >= 5
        label.new(bar_index, low - atr_avg, text = "Buying Volume Spike", color = transp, textcolor = color.lime, style=label.style_label_up)
        buy_wait := 0
if sell_spike and pltvol
    sell_wait += 1
    if sell_wait >= 5
        label.new(bar_index, high + atr_avg, text = "Selling Volume Spike", color = transp, textcolor = color.red, style=label.style_label_down)
        sell_wait := 0


// Z Reversals

highest_z = ta.highest(z, 75)
lowest_z = ta.lowest(z, 75)


var highest_wait = 0
var lowest_wait = 0
if z >= highest_z
    highest_wait += 1
    if highest_wait >= 5
        label.new(bar_index, high + atr_avg, text = "Z-Score Sell Signal", color = color.red, textcolor = color.red, style=label.style_flag)
        highest_wait := 0
if z <= lowest_z
    lowest_wait += 1
    if lowest_wait >= 5
        label.new(bar_index, high + atr_avg, text = "Z-Score Buy Signal", color = color.lime, textcolor = color.lime, style=label.style_flag)
        lowest_wait := 0

// Linear Regression Channel

if plotreg
    linreg = forecast.time_series_linear_forecast(close, forecast_cl_length, 2, 3)
https://www.tradingview.com/script/n2svuCAo-Math-Trading-Concepts-SS/