- เทคนิคของ Indicator:
- ใช้วิธีการ Kernel Regression ในสามแบบเพื่อสร้าง Oscillator ที่ครอบคลุม.
- มี Overlay Indicator เพิ่มเติมเพื่อเพิ่มความมั่นใจในสัญญาณ.
- ตรวจจับโซน Oversold และ Overbought ด้วยการใช้ Standard Deviation.
- ใช้ Epanechnikov, Wave, และ Logistic Kernel Regressions ในการประมวลผลข้อมูล.
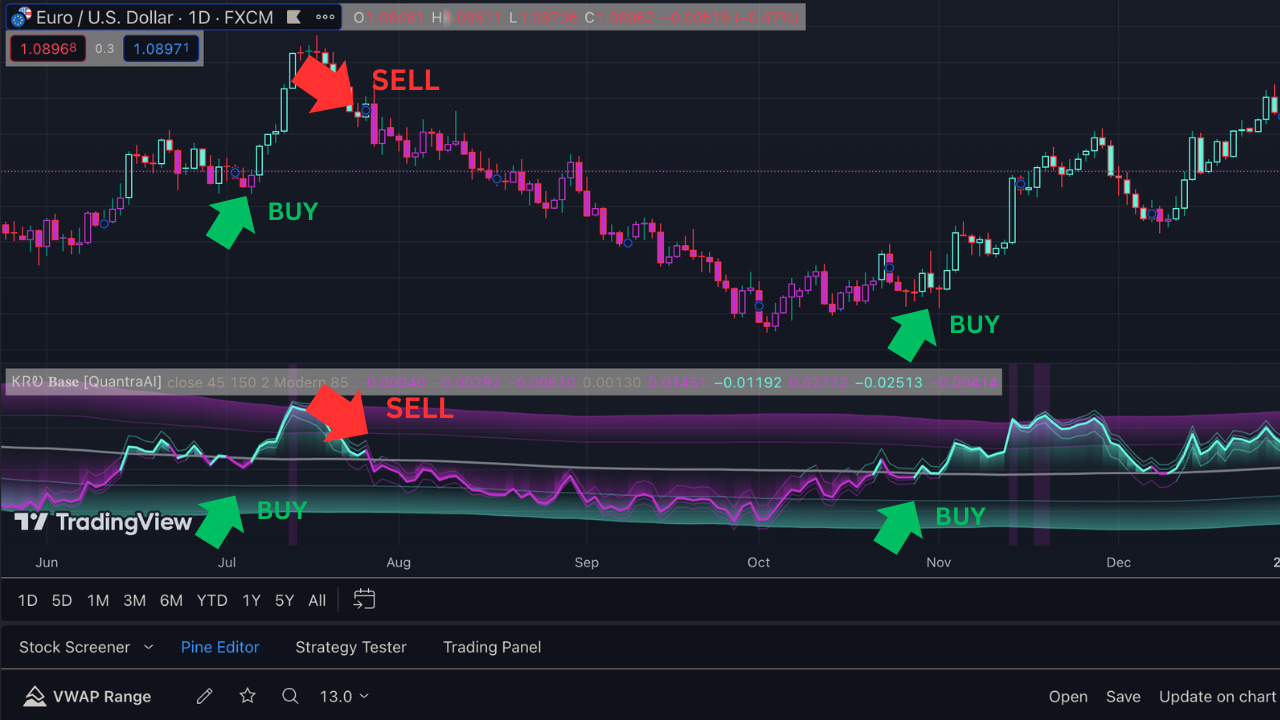
- บอกสัญญาณซื้อและขาย:
- ซื้อ: เมื่อทั้ง Overlay และ KRO แสดงสัญญาณโซน Oversold, มีโอกาสสูงที่จะเกิดการกลับตัวของแนวโน้ม.
- ขาย: เมื่อทั้ง Overlay และ KRO แสดงสัญญาณโซน Overbought, มีโอกาสสูงที่แนวโน้มจะอ่อนแอลงหรือเกิดการกลับตัว.
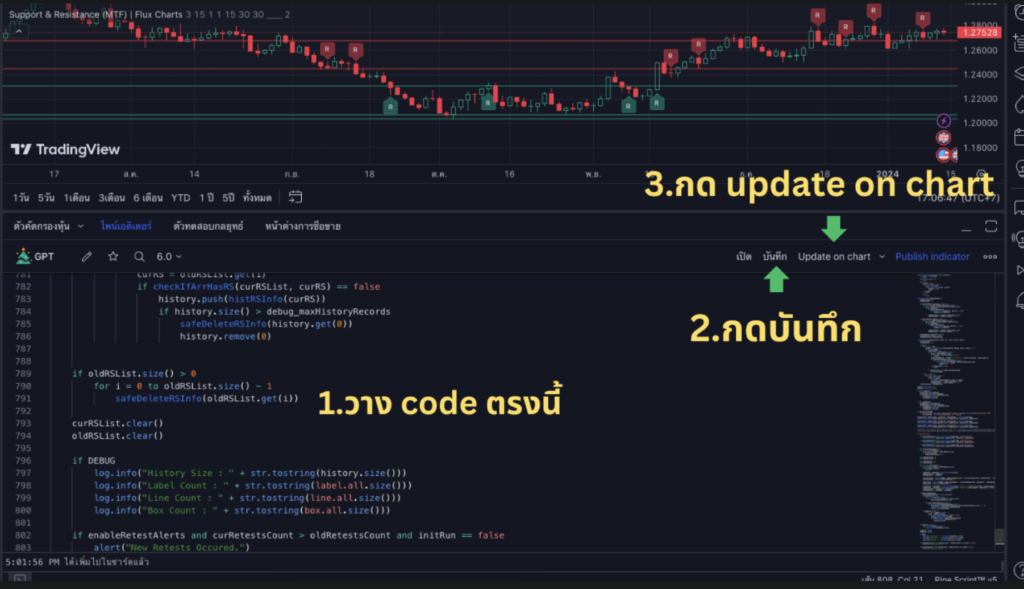
ใช้งานในโปรแกรม TradingView https://www.tradingview.com/?aff_id=134641
เปิดบัญชีทดลอง: การเริ่มต้นของ Passive Income https://bit.ly/3Sdkir2

// This Pine Script™ code is subject to the terms of the Mozilla Public License 2.0 at https://mozilla.org/MPL/2.0/
// © QuantraAI
//                              ,/((((((((((((((((((,
//                        *(((/.              *      ./(((/
//                    (((*         .((((((((          ,    ,(((
//             /* .((/      ,((*              /*.          ,,  *((,
//           (. ((/  /  ,(*           .,*****,.     /(            *((
//         (  ((.    *(.       *((*               ,(((            .  ((
//       (* ((.    (*      /(,  ,((.              ((/  .((  *(      /  ((
//      ( ,(/    (*     *(.  //                       *(   ((  (*     * ,(/
//    .( ((    *(     ((                  (                  /(        /  ((
//   .( ((    (,    .(  (*                (                .(. ((          ((
//   ( /(.   (,    (/ *(          &@@@@@@ (       &@%        *( ,(          ((
//  /. (/   //    (/          *@@.@@@@ @@,(      ,#              ,( *(      *(*
//  ( ((    (    .( ,*        @@@.*,@@@@@*(    .%   ,@@%@@/    (( (* (,      ((                  ██████╗  ██╗   ██╗  █████╗  ███╗   ██╗ ████████╗ ██████╗   █████╗
//  ( (( , ,(    (* (.      ,@@@&@@@@@@@@*(        &            (  ( ,(      /(                 ██╔═══██╗ ██║   ██║ ██╔══██╗ ████╗  ██║ ╚══██╔══╝ ██╔══██╗ ██╔══██╗
// ,* (/ * ((    (  (      @@@(*@@@@(/@@% (             .*      (  (         *(.                ██║   ██║ ██║   ██║ ███████║ ██╔██╗ ██║    ██║    ██████╔╝ ███████║
// ,/ ((   ((    (        .@@@@##%@@@@@@@*(             %&         (       / *( .(              ██║▄▄ ██║ ██║   ██║ ██╔══██║ ██║╚██╗██║    ██║    ██╔══██╗ ██╔══██║
//  ( ((    (    *(        @@@@@@@@@@ @@@*( ......(,              *(       * (( /,              ╚██████╔╝ ╚██████╔╝ ██║  ██║ ██║ ╚████║    ██║    ██║  ██║ ██║  ██║
//  ( ,(,   (.    (  (     .@@%,@% %@@@@@*(,@@@@    %...@@,       (       ,  (/ (                ╚══▀▀═╝   ╚═════╝  ╚═╝  ╚═╝ ╚═╝  ╚═══╝    ╚═╝    ╚═╝  ╚═╝ ╚═╝  ╚═╝
//  ./ ((    (     (  (.    *@@@ @@@@/(@@*(      @               (.         (( */
//   /, ((    (     (,         ,*@@@@@@@@ (       @@@           (          /(. (
//    (, ((    (.    ,(            (@@(   (                   (/ .        /(, (
//     (* ((  , *(     *(                 (                 (( .(        (( .(
//      .( /(/ .  ((  (/  ((              ,                  /(        ,(( /*
//        /* ((* .  *(  .(/  *((.                                    .(( .(
//          (, (((     ((          /((((((            /.    ((  (  *((  (
//            // .((*  ,  .((.   ./(((/*.      /((/.    ((,      ((/ *(
//               (* .(((        /(((*.         .,(((/.   /   *((/ .(.
//                  ((  *(((*     (              . ,    ,(((/  /(.
//                      /(,  .((((((*,         .*((((((,  .((.
//                           ,(((,                 ,/((,
//
//
//
//
//@version=5
indicator("Triple Confirmation Kernel Regression Oscillator Base [QuantraAI]",  "ᏦᏒᎧ 𝐁𝐚𝐬𝐞 [QuantraAI]", false, timeframe = "", timeframe_gaps = false)

var string KRS = "ᏦᏒᎧ 𝐁𝐚𝐬𝐞 - Settings", var string KRU = "ᏦᏒᎧ 𝐁𝐚𝐬𝐞 - UI"
// Kernel Regression Settings
source    = input.source(close,      "Source",                                                                          group = KRS)
bandwidth = input.int   (45,         "Bandwidth",            1,                                                         group = KRS, tooltip = "Length of the Kernel Regression calculation")
sdLook    = input.int   (150,        "Standard Deviation Lookback",                                                     group = KRS, tooltip = "Length of the SD bands lookback period")
sdMult    = input.float (2,          "Standard Deviation Extreme for OB/OS Border",                                     group = KRS, tooltip = "Defines the outer border of the SD bands. \nThe inner border begins at 50% of the SD Multiplier", step = 0.5)
Mean      = input.bool  (false,      "Use 0 as Mid Line? ",                                                             group = KRS, tooltip = "Dynamic Mid Line")
ColMode   = input.string("Modern",   "Color Palette Choice", ["Classic", "Modern", "Robust", "Accented", "Monochrome"], group = KRU, inline  = "drop")
man       = input.bool  (false,      "Custom Palette",                                                                  group = KRU, inline  = "drop")
manUpC    = input.color (#00ff00,  "Custom Up",                                                                       group = KRU, inline  = "man")
manDnC    = input.color (#ff0000,  "Custom Down",                                                                     group = KRU, inline  = "man")
BCol      = input.bool  (true,       "Enable Bar Coloring",                                                             group = KRU)
OBOS      = input.bool  (true,       "Enable Overbought/Oversold Shading",                                              group = KRU)
TR        = input.int   (85,         "Shading Transparency", 0, 100,                                                    group = KRU)


// Initialize color variables
var color UpC = na
var color DnC = na
var color BgC = na

// Assign colors based on the selected color mode
if ColMode == "Classic"
    UpC := color.lime
    DnC := color.maroon
    BgC := color.green
if ColMode == "Modern"
    UpC := #5ffae0
    DnC := #c22ed0
    BgC := #9ef6fb
if ColMode == "Robust"
    UpC := #ffbb00
    DnC := #770737
    BgC := #a23061
if ColMode == "Accented"
    UpC := #9618f7
    DnC := #ff0078
    BgC := #801155
if ColMode == "Monochrome"
    UpC := #dee2e6
    DnC := #495057
    BgC := #212529

// Switch to manual palette if selected
[UpCol, DnCol] = switch man
    false => [UpC, DnC]
    true  => [manUpC, manDnC]


  //                 //
 //    Functions    //
//                 //

kernel(source, bandwidth, kernel_type) =>
    switch kernel_type
        "Epanechnikov" => math.abs(source) <= 1 ? 0.75 * (1 - math.pow(source, 2)) : 0.0
        "Logistic"     => 1/math.exp(source + 2 + math.exp(-source))
        "Wave"         => math.abs(source) <= 1 ? (1 - math.abs(source)) * math.cos(math.pi * source) : 0.

kernelRegression(src, bandwidth, kernel_type) =>
    sumWeightedY = 0.
    sumKernels   = 0.
    for i = 0 to bandwidth - 1
        base   = i*i/math.pow(bandwidth, 2)
        kernel = kernel(base, 1, kernel_type)
        sumWeightedY += kernel * src[i]
        sumKernels   += kernel
    (src - sumWeightedY/sumKernels)/src

// Triple Confirmations
Ep = kernelRegression(source, bandwidth, 'Epanechnikov' )
Lo = kernelRegression(source, bandwidth, 'Logistic'     )
Wa = kernelRegression(source, bandwidth, 'Wave'         )

// Average
AV    = math.avg(Ep, Lo, Wa)
Mid   = Mean? 0 : ta.sma(AV, sdLook)
  //             //
 //    Plots    //
//             //

// Base Plots
plot(Ep, 'Epanechnikov', color.new(Ep > Mid ? UpCol : DnCol, 60), 1)
plot(Lo, 'Logistic'    , color.new(Lo > Mid ? UpCol : DnCol, 60), 1)
plot(Wa, 'Wave'        , color.new(Wa > Mid ? UpCol : DnCol, 60), 1)
mid = plot(Mid, "Mid", color.gray, 2)

// Calculate Dynamic OB/OS Zones
stdv_bands(_src, _length, _mult) =>
    float basis = ta.sma(_src, _length)
    float dev   = _mult * ta.stdev(_src, _length)
    [basis, basis + dev, basis - dev]

[_, u1, l1] = stdv_bands(AV, sdLook, sdMult/2)
[_, u2, l2] = stdv_bands(AV, sdLook, sdMult)


// Final Plots + Fill
pu1 = plot(u1, "1.𝓢𝓓 +", color.new(DnCol, 70))
pl1 = plot(l1, "1.𝓢𝓓 -", color.new(UpCol, 70))
pu2 = plot(u2, "2.𝓢𝓓 +", color.new(DnCol, 70))
pl2 = plot(l2, "2.𝓢𝓓 -", color.new(UpCol, 70))
pAV = plot(AV, "ᏦᏒᎧ", AV > Mid ? UpCol : DnCol, 2)
fill(mid, pAV, AV, Mid,color.new (AV > Mid ? UpCol : DnCol, 50), color.new(chart.bg_color, 75))
fill(pu1, pu2, u2, u1, color.new(DnCol, 60), color.new(chart.bg_color, 55))
fill(pl1, pl2, l2, l1, color.new(UpCol, 60), color.new(chart.bg_color, 55))

bgcolor (OBOS ? (AV > u2  ? color.new(DnCol, TR) : AV < l2 ? color.new(UpCol, TR) : na) : na)
barcolor(BCol ? (AV > Mid ? UpCol : DnCol) : na)


// Alerts
symbol = "ᏦᏒᎧ 𝐁𝐚𝐬𝐞 [QuantraAI] >>> {{exchange}}:{{ticker}}"

// Trend Following Alerts
alertcondition(AV > Mid and AV[1] <= Mid, "Trend Up",            symbol + " Trend Following - Long Entry!"  )
alertcondition(AV < Mid and AV[1] >= Mid, "Trend Down",          symbol + " Trend Following - Short Entry!" )
// Extremity Alerts
alertcondition(AV < l2,                   "Extremes - OS Zone",  symbol + " Extreme - OS Zone!"             )
alertcondition(AV > u2,                   "Extremes - OB Zone",  symbol + " Extreme - OB Zone!"             )
https://www.tradingview.com/script/tQ7O9bpf-Triple-Confirmation-Kernel-Regression-Base-QuantraAI/