
แจกระบบเทรดโดยAI (กดดูเพิ่มเติม)
ผมได้ไปเจอคลิปนี้ มีการแจกระบบเทรดของลุงโฉลก ซึ่งเป็น CDC ActionZone ก็เลยเอาไปปรับแต่งเพิ่มนิดๆหน่อยๆ ให้ทำการเปิดสัญญาณซื้อขาย กับเพิ่มสัญลักษณ์การใช้งานให้ง่ายขึ้น

1.เปิดบัญชีทดลอง
ทดลองเทรด Binaryoption (เหมาะก็ต่อเมื่อเปิดดูสัญญาณ TF 1H ขึ้นไป) ฝึกฝนเทรดฟรีคลิกที่นี่
ทดลองเทรดForex (ใช้ได้ดีกับสัญญาณนี้) ฝึกฝนเทรดฟรีคลิกที่นี่
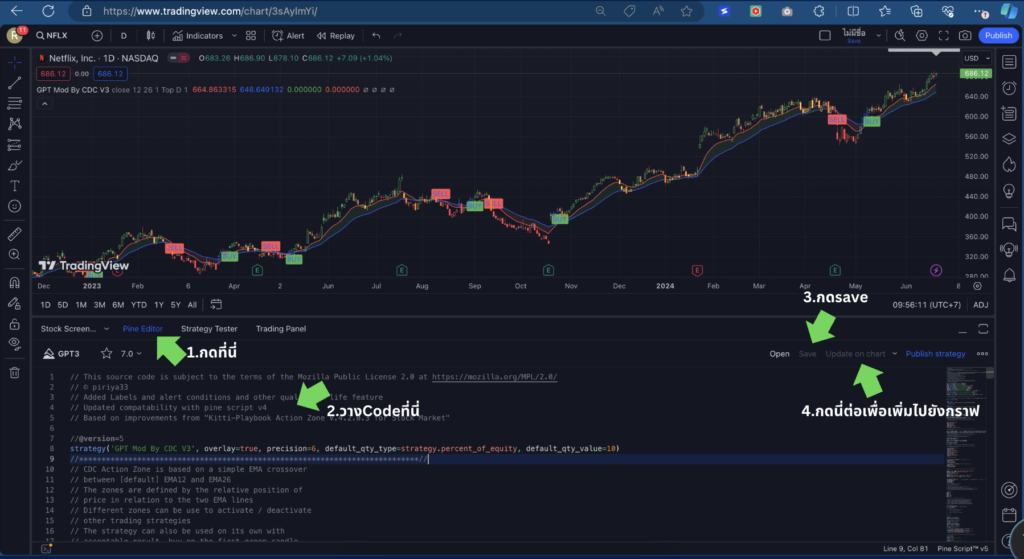
2.ไปที่ https://www.tradingview.com/ แล้วเอาCodeที่ผมแจก ก็อปวางได้เลยครับ
// This source code is subject to the terms of the Mozilla Public License 2.0 at https://mozilla.org/MPL/2.0/
// © piriya33
// Added Labels and alert conditions and other quality of life feature
// Updated compatability with pine script v4
// Based on improvements from "Kitti-Playbook Action Zone V.4.2.0.3 for Stock Market"

//@version=5
strategy('GPT Mod By CDC V3', overlay=true, precision=6, default_qty_type=strategy.percent_of_equity, default_qty_value=10)
//****************************************************************************//
// CDC Action Zone is based on a simple EMA crossover
// between [default] EMA12 and EMA26
// The zones are defined by the relative position of
// price in relation to the two EMA lines
// Different zones can be use to activate / deactivate
// other trading strategies
// The strategy can also be used on its own with
// acceptable result, buy on the first green candle
// and sell on the first red candle
//****************************************************************************//
//****************************************************************************//
// Define User Input Variables

xsrc = input.source(title='Source Data', defval=close)
xprd1 = input.int(title='Fast EMA period', defval=12)
xprd2 = input.int(title='Slow EMA period', defval=26)
xsmooth = input.int(title='Smoothing period (1 = no smoothing)', defval=1)
fillSW = input.bool(title='Paint Bar Colors', defval=true)
fastSW = input.bool(title='Show fast moving average line', defval=true)
slowSW = input.bool(title='Show slow moving average line', defval=true)
labelSwitch = input.bool(title='Turn on assistive text', defval=true)
plotSigsw = input.bool(title='Plot Buy/Sell Signals? ', defval=true)
plotRibsw = input.bool(title='Plot Buy/Sell Ribbon', defval=false)
plotRibbonPos = input.string(title='Ribbon Position', options=['Top', 'Bottom'], defval='Top')

xfixtf = input.bool(title='** Use Fixed time frame Mode (advanced) **', defval=false)
xtf = input.timeframe(title='** Fix chart to which time frame ? **)', defval='D')

plotSig2sw = input.bool(title='Plot momentum based Buy/Sell Signals? ', defval=false)
plotSig2lv = input.int(title='Set signal threshold (higher = stricter)', defval=1, minval=0, maxval=1)

//****************************************************************************//
//Calculate Indicators

f_secureSecurity(_symbol, _res, _src) => request.security(_symbol, _res, _src[1], lookahead = barmerge.lookahead_on) // Using f_secureSecurity to avoid repainting

xPrice = ta.ema(xsrc, xsmooth)


FastMA = xfixtf ?
 ta.ema(f_secureSecurity(syminfo.tickerid, xtf, ta.ema(xsrc, xprd1)), xsmooth)
 :
 ta.ema(xPrice, xprd1)


SlowMA = xfixtf ?
 ta.ema(f_secureSecurity(syminfo.tickerid, xtf, ta.ema(xsrc, xprd2)), xsmooth)
 :
 ta.ema(xPrice, xprd2)

Bull = FastMA > SlowMA
Bear = FastMA < SlowMA

//****************************************************************************//
// Define Color Zones

Green = Bull and xPrice > FastMA  // Buy
Blue = Bear and xPrice > FastMA and xPrice > SlowMA  //Pre Buy 2
LBlue = Bear and xPrice > FastMA and xPrice < SlowMA  //Pre Buy 1

Red = Bear and xPrice < FastMA  // Sell
Orange = Bull and xPrice < FastMA and xPrice < SlowMA  // Pre Sell 2
Yellow = Bull and xPrice < FastMA and xPrice > SlowMA  // Pre Sell 1

//****************************************************************************//
// Display color on chart


bColor = Green ? color.green :
 Blue ? color.blue :
 LBlue ? color.aqua :
 Red ? color.red :
 Orange ? color.orange :
 Yellow ? color.yellow :
 color.black
barcolor(color=fillSW ? bColor : na)

//****************************************************************************//
// Display MA lines

FastL = plot(fastSW ? FastMA : na, 'Fast EMA', color=color.new(color.red, 0), style = xfixtf ? plot.style_stepline : plot.style_line)
SlowL = plot(slowSW ? SlowMA : na, 'Slow EMA', color=color.new(color.blue, 0), style = xfixtf ? plot.style_stepline : plot.style_line)
fillcolor = Bull ? color.new(color.green,90) : Bear ? color.new(color.red,90) : color.new(color.black,90) // fillcolor = Bull ? color.green : Bear ? color.red : color.black
fill(FastL, SlowL, fillcolor) // fill(FastL, SlowL, fillcolor, transp=90)

//****************************************************************************//
// Define Buy and Sell condition
// This is only for thebasic usage of CDC Actionzone (EMA Crossover)
// ie. Buy on first green bar and sell on first red bar

buycond = Green and Green[1] == 0
sellcond = Red and Red[1] == 0

bullish = ta.barssince(buycond) < ta.barssince(sellcond)
bearish = ta.barssince(sellcond) < ta.barssince(buycond)

buy = bearish[1] and buycond
sell = bullish[1] and sellcond

bColor_BullBear = bullish ? color.green : bearish ? color.red : color.black

//****************************************************************************//
// Plot Buy and Sell point on chart

plotshape(plotSigsw ? buy : na,
 style=shape.labelup,
 title='Buy Signal',
 location=location.belowbar,
 color=color.new(color.green, 0),
 text="BUY")
plotshape(plotSigsw ? sell : na,
 style=shape.labeldown,
 title='Sell Signal',
 location=location.abovebar,
 color=color.new(color.red, 0),
 text="SELL")

// Display Buy/Sell Ribbon


plotshape(plotRibsw ? plotRibbonPos == 'Top' ? close : na : na,
 style=shape.square,
 title='Buy/Sell Ribbon',
 location=location.top,
 color=bColor_BullBear)

plotshape(plotRibsw ? plotRibbonPos == 'Bottom' ? close : na : na,
 style=shape.square,
 title='Buy/Sell Ribbon',
 location=location.bottom,
 color=bColor_BullBear)


//****************************************************************************//
// Label

labelstyle = close > SlowMA ? label.style_label_down : label.style_label_up
labelyloc = close > SlowMA ? yloc.abovebar : yloc.belowbar
labeltcolor = buy ? color.black :
 sell ? color.white :
 close > close[1] ? color.green :
 color.red
labelbgcolor = buy ? color.green : sell ? color.red : color.silver
labeltext = buy ? 'BUY next bar\n' : sell ? 'SELL next bar\n' : ' '
trendText = bullish ? 'bullish' : bearish ? 'bearish' : 'sideways'


l1 = label.new(bar_index, na,
 text=labeltext + syminfo.ticker + ' ' + str.tostring(close) + ' ' + syminfo.currency + '\n currently in a ' + trendText + ' trend \n',
 color=labelbgcolor,
 textcolor=labeltcolor,
 yloc=labelyloc,
 style=labelstyle)

label.delete(labelSwitch ? l1[1] : l1)

// Momentum Signal using StochRSI

// Adds a momentum based signal following trends to the script
// Default is hidden, only use with caution
// Parameters for STOCH RSI is hard-coded to avoid cluttering the input screen further
// If you need to change anything, make a copy of the code and change it.
// Inputs are commented out, to enable them comment out the hard coded variables first!

// fixed inputs //

smoothK = 3
smoothD = 3
RSIlen = 14
STOlen = 14
SRsrc = close
OSlevel = 30
OBlevel = 70

// User inputs // // COMMENT ABOVE VARIABLES FIRST!!

// smoothK = input(3,"StochRSI smooth K",type=input.integer,minval=1)
// smoothD = input(3,"StochRSI smooth D",type=input.integer,minval=1)
// RSIlen = input(14,"RSI length",type=input.integer,minval=1)
// STOlen = input(14,"Stochastic length",type=input.integer,minval=1)
// SRsrc = input(close,"Source for StochasticRSI",type=input.source)
// OSlevel = input(30,"Oversold Threshold",type=input.float,minval=0.00)
// OBlevel = input(70,"Oversold Threshold",type=input.float,minval=0.00)

// calculations //
rsi1 = ta.rsi(SRsrc, RSIlen)
k = ta.sma(ta.stoch(rsi1, rsi1, rsi1, STOlen), smoothK)
d = ta.sma(k, smoothD)

// storsiBuySig =  if bullish
//     if (d < OSlevel and crossover(k,d))
//         3
//     else if crossover(k,OSlevel)
//         2
//     else if d > OSlevel and crossover(k,d)
//         1
//     else
//         0
// else
//     0

crossover_1 = ta.crossover(k, d)
crossover_2 = ta.crossover(k, d)
iff_1 = d > OSlevel and crossover_2 ?
 1 : 0
iff_2 = d < OSlevel and crossover_1 ?
 2 : iff_1
storsiBuySig = bullish ? iff_2 : 0

crossunder_1 = ta.crossunder(k, d)
crossunder_2 = ta.crossunder(k, d)
iff_3 = d < OBlevel and crossunder_2 ?
 1 : 0
iff_4 = d > OBlevel and crossunder_1 ?
 2 : iff_3
storsiSellSig = bearish ? iff_4 : 0

plotshape(plotSig2sw ? storsiBuySig > plotSig2lv ? storsiBuySig : na : na,
 'Buy more signals', style=shape.triangleup,
  location=location.belowbar, color=color.new(color.teal, 0))
plotshape(plotSig2sw ? storsiSellSig > plotSig2lv ? storsiSellSig : na : na,
 'Sell more signals', style=shape.triangledown,
  location=location.abovebar, color=color.new(color.orange, 0))


//****************************************************************************//
// Alert conditions

alertcondition(buy,
 title='*Buy Alert',
 message='Buy {{exchange}}:{{ticker}}')

alertcondition(sell,
 title='*Sell Alert',
 message='Sell {{exchange}}:{{ticker}}')

alertcondition(bullish,
 title='is Bullish')

alertcondition(bearish,
 title='is Bearish')

alertcondition(Green,
 title='is Green')

alertcondition(Blue,
 title='is Blue (Strong Rally)')

alertcondition(LBlue,
 title='is Light Blue (Rally)')

alertcondition(Red,
 title='is Red')

alertcondition(Orange,
 title='is Orange (Strong Dip)')

alertcondition(Yellow,
 title='is Yellow (Dip)')


//****************************************************************************//

// Entry and Exit Strategy
if (buy)
    strategy.entry("Buy", strategy.long)

if (sell)
    strategy.close("Buy")