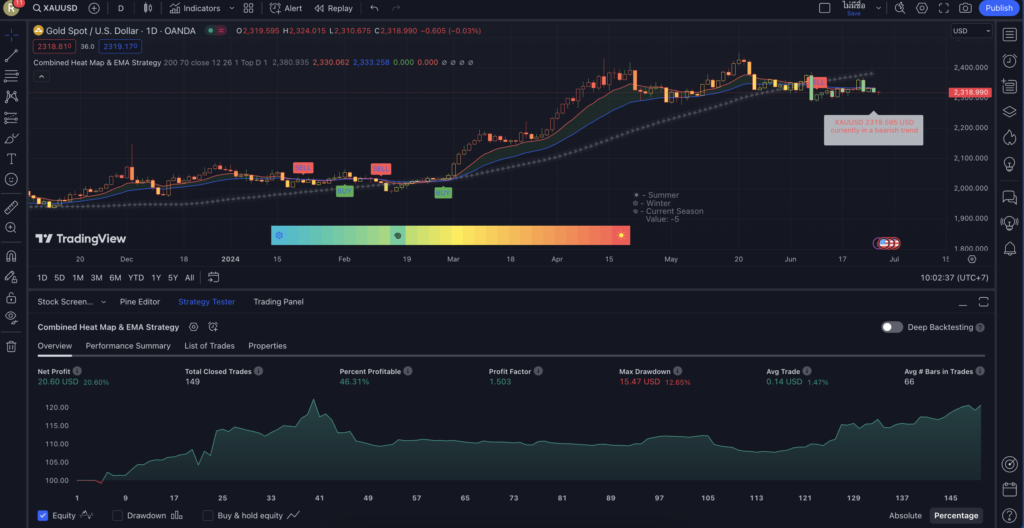
ตัวนี้จะเป็นการผสม EMA กับ HeatMap
- ซื้อ (Buy):
- เมื่อบาร์มีสีฟ้าหรือเขียว (ค่าความร้อนต่ำ) และราคาเริ่มมีแนวโน้มขึ้นใกล้เส้นการถดถอย
- เมื่อค่าความร้อนเปลี่ยนจากเย็นไปเป็นอุ่น (ฟ้าสู่เหลือง)
- ขาย (Sell):
- เมื่อบาร์มีสีเหลืองหรือแดง (ค่าความร้อนสูง) และราคาเริ่มมีแนวโน้มลงต่ำกว่าเส้นการถดถอย
- เมื่อค่าความร้อนเปลี่ยนจากอุ่นไปเป็นร้อน (เหลืองสู่แดง)
ทดลองโปรแกรมเทรด เทรดฟรีคลิกที่นี่
Step 1 : ไปที่ https://www.tradingview.com/ แล้วเอาCodeที่ผมแจก ก็อปวางได้เลยครับ
การติดตั้ง
Code
//@version=5
strategy("Combined Heat Map & EMA Strategy", overlay=true, default_qty_type=strategy.percent_of_equity, default_qty_value=10)

// ————— User Inputs
int Length         = input.int(200, "Length")
int heat_sensative = input.int(70, "Heat Sensitivity", step = 10)
bool show_line     = input.bool(true, "Show Regression Line?")
xsrc = input.source(title='Source Data', defval=close)
xprd1 = input.int(title='Fast EMA period', defval=12)
xprd2 = input.int(title='Slow EMA period', defval=26)
xsmooth = input.int(title='Smoothing period (1 = no smoothing)', defval=1)
fillSW = input.bool(title='Paint Bar Colors', defval=true)
fastSW = input.bool(title='Show fast moving average line', defval=true)
slowSW = input.bool(title='Show slow moving average line', defval=true)
labelSwitch = input.bool(title='Turn on assistive text', defval=true)
plotSigsw = input.bool(title='Plot Buy/Sell Signals? ', defval=true)
plotRibsw = input.bool(title='Plot Buy/Sell Ribbon', defval=false)
plotRibbonPos = input.string(title='Ribbon Position', options=['Top', 'Bottom'], defval='Top')
xfixtf = input.bool(title='** Use Fixed time frame Mode (advanced) **', defval=false)
xtf = input.timeframe(title='** Fix chart to which time frame ? **)', defval='D')
plotSig2sw = input.bool(title='Plot momentum based Buy/Sell Signals? ', defval=false)
plotSig2lv = input.int(title='Set signal threshold (higher = stricter)', defval=1, minval=0, maxval=1)

// ————— Normalization Function
normalization(src, mean)=>
    norm = (src - mean) / ta.stdev(src, 200)
    norm > 5 ? 5 : norm < -5 ? -5 : norm

// ————— Rescale Function (when range is known).
rescale(_src, _oldMin, _oldMax, _newMin, _newMax) =>
    _newMin + (_newMax - _newMin) * (_src - _oldMin) / math.max(_oldMax - _oldMin, 10e-10)

// ————— Regression Line Formula
Regression_Line(length)=>
    x  = bar_index
    y  = hl2
    x_ = ta.sma(x,length)
    y_ = ta.sma(y,length)
    mx = ta.stdev(x,length)
    my = ta.stdev(y,length)
    c  = ta.correlation(x,y,length)
    slope = c * (my/mx)
    inter = y_ - slope*x_
    x*slope + inter

Regression_Line = Regression_Line(Length)

// ————— Heat Map Color Bars
color_level = normalization(close - Regression_Line, 0)
color = color_level > 0
 ? color.from_gradient(color_level, 0, ta.highest(color_level, heat_sensative), color.yellow, color.red)
 : color.from_gradient(color_level, ta.lowest(color_level, heat_sensative), 0, color.aqua, color.yellow)
barcolor(color)

// Plot of Regression_Line
plot(show_line ? Regression_Line : na, color = color.rgb(120, 123, 134, 60), linewidth = 1, style = plot.style_stepline_diamond)

// ————— Plot Gauge
tbl = table.new(position.bottom_center, 100, 10)

for i = 0 to 29 by 1
    table.cell(tbl, i, 1, "",
     bgcolor = i < 15
      ? color.from_gradient(i, 0, 15, color.aqua, color.yellow)
         : color.from_gradient(i, 15, 30, color.yellow, color.red)
          )

g_p = rescale(color_level, -4, 5, 0, 30)

// Summer Winter marks and gauge point
table.cell(tbl, 0, 1, "❆", text_color = color.rgb(32, 91, 255), text_size = size.large, bgcolor = color.aqua)
table.cell(tbl, 29, 1, "☀︎", text_color = color.rgb(255, 238, 0), text_size = size.large, bgcolor = color.red)
table.cell(tbl, math.round(g_p < 0 ? 0 : g_p), 1, "𖦹", text_color = color.rgb(0, 0, 0), text_size = size.large, bgcolor = color)
table.cell(tbl, 35, 0, "☀︎ - Summer\n❆ - Winter\n𖦹 - Current Season\n " + "     Value: " + str.tostring(math.round(g_p < 0 ? 0 : g_p)-15), text_halign = text.align_left, text_color = color.gray)

var float lastTradePrice = na
var float lastColorLevel = na

// Define trade entry and exit conditions
longCondition = (color_level < -2 and (na(lastColorLevel) or lastColorLevel >= -2))
shortCondition = (color_level > 2 and (na(lastColorLevel) or lastColorLevel <= 2))

if (longCondition)
    strategy.entry("Long", strategy.long)

if (shortCondition)
    strategy.entry("Short", strategy.short)

lastColorLevel := color_level

//****************************************************************************//
// CDC Action Zone Strategy

f_secureSecurity(_symbol, _res, _src) => request.security(_symbol, _res, _src[1], lookahead = barmerge.lookahead_on)

xPrice = ta.ema(xsrc, xsmooth)
FastMA = xfixtf ?
 ta.ema(f_secureSecurity(syminfo.tickerid, xtf, ta.ema(xsrc, xprd1)), xsmooth)
 :
 ta.ema(xPrice, xprd1)

SlowMA = xfixtf ?
 ta.ema(f_secureSecurity(syminfo.tickerid, xtf, ta.ema(xsrc, xprd2)), xsmooth)
 :
 ta.ema(xPrice, xprd2)

Bull = FastMA > SlowMA
Bear = FastMA < SlowMA

// Define Color Zones
Green = Bull and xPrice > FastMA
Blue = Bear and xPrice > FastMA and xPrice > SlowMA
LBlue = Bear and xPrice > FastMA and xPrice < SlowMA
Red = Bear and xPrice < FastMA
Orange = Bull and xPrice < FastMA and xPrice < SlowMA
Yellow = Bull and xPrice < FastMA and xPrice > SlowMA

// Display color on chart
bColor = Green ? color.green :
 Blue ? color.blue :
 LBlue ? color.aqua :
 Red ? color.red :
 Orange ? color.orange :
 Yellow ? color.yellow :
 color.black
barcolor(color=fillSW ? bColor : na)

// Display MA lines
FastL = plot(fastSW ? FastMA : na, 'Fast EMA', color=color.new(color.red, 0), style = xfixtf ? plot.style_stepline : plot.style_line)
SlowL = plot(slowSW ? SlowMA : na, 'Slow EMA', color=color.new(color.blue, 0), style = xfixtf ? plot.style_stepline : plot.style_line)
fillcolor = Bull ? color.new(color.green,90) : Bear ? color.new(color.red,90) : color.new(color.black,90)
fill(FastL, SlowL, fillcolor)

// Define Buy and Sell condition
buycond = Green and Green[1] == 0
sellcond = Red and Red[1] == 0

bullish = ta.barssince(buycond) < ta.barssince(sellcond)
bearish = ta.barssince(sellcond) < ta.barssince(buycond)

buy = bearish[1] and buycond
sell = bullish[1] and sellcond

bColor_BullBear = bullish ? color.green : bearish ? color.red : color.black

// Plot Buy and Sell point on chart
plotshape(plotSigsw ? buy : na,
 style=shape.labelup,
 title='Buy Signal',
 location=location.belowbar,
 color=color.new(color.green, 0),
 text="BUY")
plotshape(plotSigsw ? sell : na,
 style=shape.labeldown,
 title='Sell Signal',
 location=location.abovebar,
 color=color.new(color.red, 0),
 text="SELL")

// Display Buy/Sell Ribbon
plotshape(plotRibsw ? plotRibbonPos == 'Top' ? close : na : na,
 style=shape.square,
 title='Buy/Sell Ribbon',
 location=location.top,
 color=bColor_BullBear)
plotshape(plotRibsw ? plotRibbonPos == 'Bottom' ? close : na : na,
 style=shape.square,
 title='Buy/Sell Ribbon',
 location=location.bottom,
 color=bColor_BullBear)

// Label
labelstyle = close > SlowMA ? label.style_label_down : label.style_label_up
labelyloc = close > SlowMA ? yloc.abovebar : yloc.belowbar
labeltcolor = buy ? color.black :
 sell ? color.white :
 close > close[1] ? color.green :
 color.red
labelbgcolor = buy ? color.green : sell ? color.red : color.silver
labeltext = buy ? 'BUY next bar\n' : sell ? 'SELL next bar\n' : ' '
trendText = bullish ? 'bullish' : bearish ? 'bearish' : 'sideways'

l1 = label.new(bar_index, na,
 text=labeltext + syminfo.ticker + ' ' + str.tostring(close) + ' ' + syminfo.currency + '\n currently in a ' + trendText + ' trend \n',
 color=labelbgcolor,
 textcolor=labeltcolor,
 yloc=labelyloc,
 style=labelstyle)

label.delete(labelSwitch ? l1[1] : l1)

// Momentum Signal using StochRSI
smoothK = 3
smoothD = 3
RSIlen = 14
STOlen = 14
SRsrc = close
OSlevel = 30
OBlevel = 70

rsi1 = ta.rsi(SRsrc, RSIlen)
k = ta.sma(ta.stoch(rsi1, rsi1, rsi1, STOlen), smoothK)
d = ta.sma(k, smoothD)

crossover_1 = ta.crossover(k, d)
crossover_2 = ta.crossover(k, d)
iff_1 = d > OSlevel and crossover_2 ? 1 : 0
iff_2 = d < OSlevel and crossover_1 ? 2 : iff_1
storsiBuySig = bullish ? iff_2 : 0

crossunder_1 = ta.crossunder(k, d)
crossunder_2 = ta.crossunder(k, d)
iff_3 = d < OBlevel and crossunder_2 ? 1 : 0
iff_4 = d > OBlevel and crossunder_1 ? 2 : iff_3
storsiSellSig = bearish ? iff_4 : 0

plotshape(plotSig2sw ? storsiBuySig > plotSig2lv ? storsiBuySig : na : na,
 'Buy more signals', style=shape.triangleup,
  location=location.belowbar, color=color.new(color.teal, 0))
plotshape(plotSig2sw ? storsiSellSig > plotSig2lv ? storsiSellSig : na : na,
 'Sell more signals', style=shape.triangledown,
  location=location.abovebar, color=color.new(color.orange, 0))

// Alert conditions
alertcondition(buy,
 title='*Buy Alert',
 message='Buy {{exchange}}:{{ticker}}')

alertcondition(sell,
 title='*Sell Alert',
 message='Sell {{exchange}}:{{ticker}}')

alertcondition(bullish,
 title='is Bullish')

alertcondition(bearish,
 title='is Bearish')

alertcondition(Green,
 title='is Green')

alertcondition(Blue,
 title='is Blue (Strong Rally)')

alertcondition(LBlue,
 title='is Light Blue (Rally)')

alertcondition(Red,
 title='is Red')

alertcondition(Orange,
 title='is Orange (Strong Dip)')

alertcondition(Yellow,
 title='is Yellow (Dip)')

// Entry and Exit Strategy
if (buy)
    strategy.entry("Buy", strategy.long)

if (sell)
    strategy.close("Buy")


คอร์สนี้เหมาะสำหรับ
![]() ผู้ประกอบการ เจ้าของธุรกิจ ที่อยากนำ AI มาช่วยเพิ่มผลกำไร เพิ่มยอดขาย
ผู้ประกอบการ เจ้าของธุรกิจ ที่อยากนำ AI มาช่วยเพิ่มผลกำไร เพิ่มยอดขาย![]() มนุษย์เงินเดือน ที่ต้องการอัพสกิลตัวเอง เพื่อเพิ่มโอกาสในอาชีพการงาน
มนุษย์เงินเดือน ที่ต้องการอัพสกิลตัวเอง เพื่อเพิ่มโอกาสในอาชีพการงาน![]() ผู้ที่สนใจเทคโนโลยี AI และต้องการนำไปประยุกต์ใช้ในชีวิตประจำวัน
ผู้ที่สนใจเทคโนโลยี AI และต้องการนำไปประยุกต์ใช้ในชีวิตประจำวัน![]() นักลงทุน ที่ต้องการให้ AI ช่วยตัดสินใจในการลงทุน
นักลงทุน ที่ต้องการให้ AI ช่วยตัดสินใจในการลงทุน
สิ่งที่คุณจะได้เรียนรู้ในคอร์ส
![]() ปูพื้นฐาน AI และ ChatGPT จากระดับเริ่มต้นจนใช้งานเป็น
ปูพื้นฐาน AI และ ChatGPT จากระดับเริ่มต้นจนใช้งานเป็น![]() เทคนิคการ Prompt ให้ AI ทำงานตามที่เราต้องการ
เทคนิคการ Prompt ให้ AI ทำงานตามที่เราต้องการ![]() ประยุกต์ใช้ AI ในด้านต่างๆ เช่น การตลาด, Content Creation, SEO
ประยุกต์ใช้ AI ในด้านต่างๆ เช่น การตลาด, Content Creation, SEO![]() สร้างรูปภาพ วิดีโอ ด้วย AI อย่าง DALL-E
สร้างรูปภาพ วิดีโอ ด้วย AI อย่าง DALL-E![]() เรียนรู้การใช้ AI ช่วยเหลือในการลงทุน
เรียนรู้การใช้ AI ช่วยเหลือในการลงทุน![]() AI อีกมากมายที่จะช่วยให้ชีวิดและธุรกิจของคุณง่ายขึ้น
AI อีกมากมายที่จะช่วยให้ชีวิดและธุรกิจของคุณง่ายขึ้น

เนื้อหาทั้งหมด 9+1 Module(เลื่อนดูได้)


ตัวอย่างเนื้อหาที่น่าสนใจ
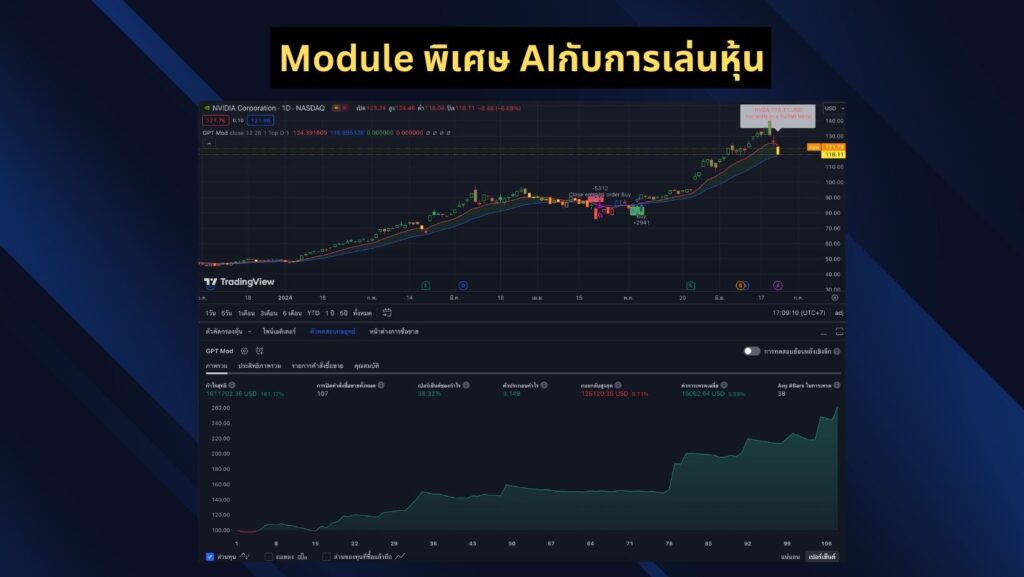
1.ใช้AIช่วยเขียนโปรแกรมเทรดหุ้น มีCodeที่ได้จากAI แจกฟรี
2.ใช้AIสร้างรูปฟรี
3.ใช้AI ถอดเสียงประชุม->สรุป->ทำMindmap

และยังมีการประยุกต์ใช้อื่นๆอีกมากมาย
![]() ใช้ Gemini วางแผนการเรียน พร้อมตัวอย่างการใช้งาน
ใช้ Gemini วางแผนการเรียน พร้อมตัวอย่างการใช้งาน
📝 Workshop เพจสอนพิเศษคณิตศาสตร์
💬 workshop เพจ ธุรกิจสอนภาษาอังกฤษ
📝 ลองให้ ChatGPT สอนเขียน HTML CSS สอนดีไม่พอสรุปได้ดีด้วย
🚀 สอนสร้างหน้าเวปใน5นาที ด้วย ChatGPT ไม่ต้องเขียนCodeเองแม้แต่ตัวเดียว
🎥 AI สรุปคลิป youtube
💡 ใช้ ChatGPT ออกไอเดียทำคลิปวีดีโอ
🗺️ ChatGPT เขียน Mind Mapping ได้ด้วย
🔍 ใช้ Chat GPT ช่วยหารูปได้ด้วย
📚 ล้ำจัด ให้ AI แต่งนิทาน พร้อมภาพประกอบ คอมโบ ChatGPT+Midjourney+Canva
🖌️ ทำรูปสมุดระบายสี ด้วย Midjourney
📈 ใช้ ChatGPT เขียน SEO ตั้งแต่เริ่ม
📊 50 marketing Prompt
🖼️ สร้างรูปฟรีๆผ่าน ChatGPT
🖥️ ใช้ ChatGPT สร้างslide แบบ powerpoint
📺 สร้างคำอธิบายคลิป Youtube เพิ่ม SEO
.
.
.
ดูเนื้อหาทั้งหมดคลิกที่นี่

ทั้งหมดนี้เพียง 3,990 บาท ก่อนปรับเป็นราคาเต็ม 8,990 ในอนาคต
สนใจเรียนทักไลน์ที่Linkนี้ได้เลย https://lin.ee/cNinyoE
หรือผ่อนชำระ10เดือน ผ่าน Shoppee