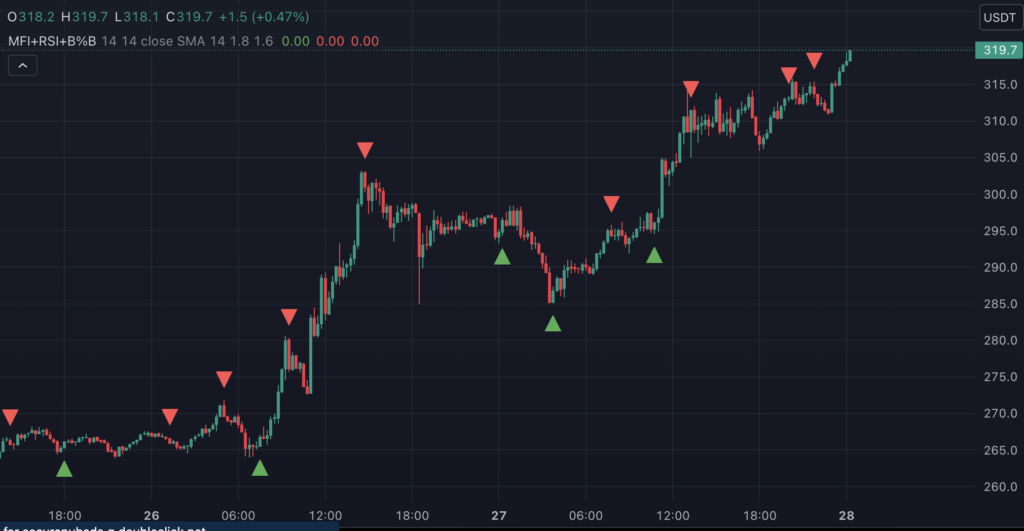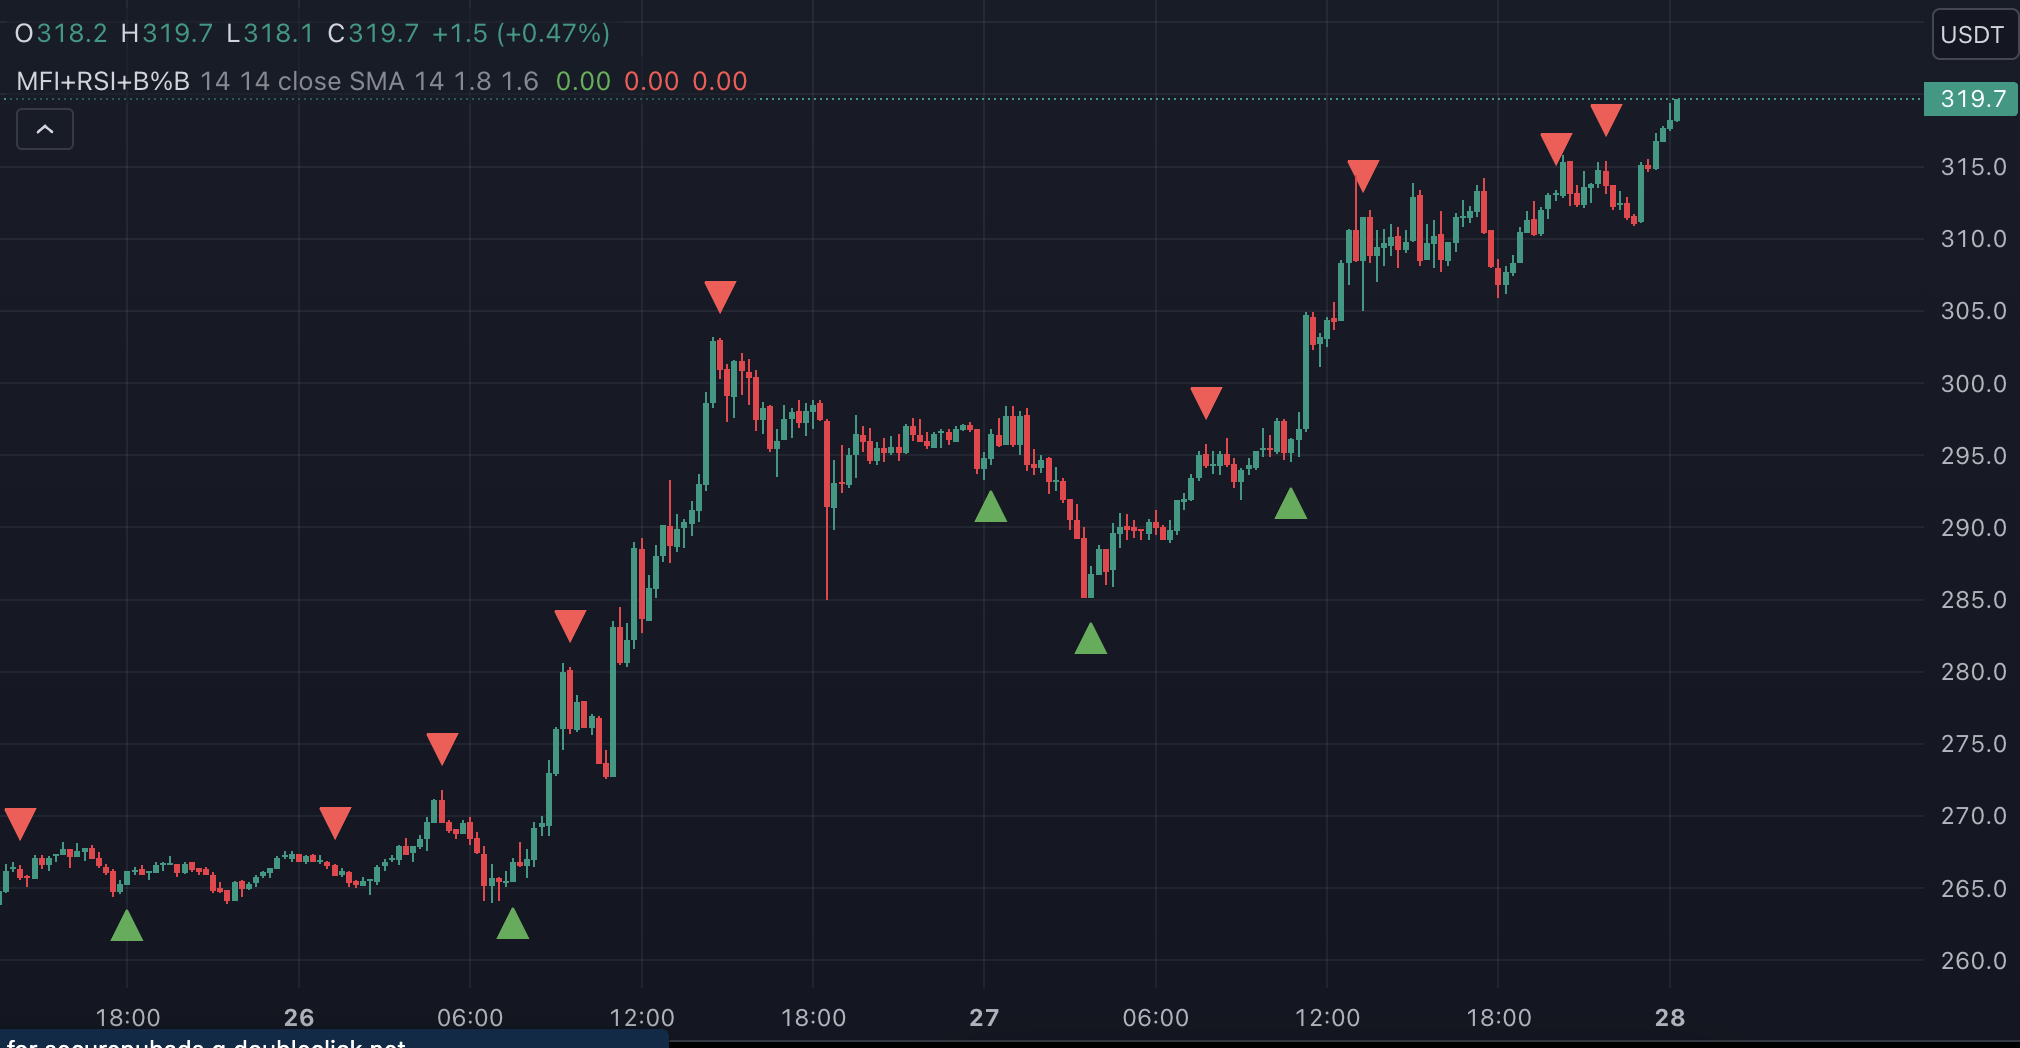
- เทคนิคที่ใช้:
- ใช้ MFI ซึ่งตั้งค่าจากความยาวที่กำหนด พร้อมระดับซื้อมากเกินไปและขายมากเกินไป (80 และ 20 ตามลำดับ)
- ปรับใช้ RSI โดยสามารถเลือกประเภทของเฉลี่ยเคลื่อนที่ (SMA, EMA ฯลฯ) สำหรับการคำนวณ RSI
- ใช้ Bollinger Bands โดยมีแถบบนและล่างตามการเบี่ยงเบนมาตรฐานของ RSI
- สัญญาณซื้อเกิดเมื่อ:
- RSI และ MFI ของแท่งเทียนล่าสุดอยู่ใต้แถบ Bollinger และในแท่งเทียนปัจจุบัน RSI ข้ามขึ้นมาเหนือแถบ Bollinger แถบล่าง
- สัญญาณขายเกิดเมื่อ:
- RSI และ MFI ของแท่งเทียนล่าสุดอยู่เหนือแถบ Bollinger และในแท่งเทียนปัจจุบัน RSI ข้ามลงมาเหนือแถบ Bollinger แถบบน
- ใช้งานในโปรแกรม TradingView https://www.tradingview.com/?aff_id=134641
- เปิดบัญชีทดลอง: การเริ่มต้นของ Passive Income https://bit.ly/3Sdkir2
//@diegorccp
//@version=5
indicator(title=".", shorttitle="MFI+RSI+B%B",overlay = true, format=format.price, precision=2, timeframe="", timeframe_gaps=true)

var longPos = 0
length = input.int(title="Length", defval=14, minval=1, maxval=2000)
src = hlc3
mf = ta.mfi(src, length)


ma(source, length, type) =>
    switch type
        "SMA" => ta.sma(source, length)
        "Bollinger Bands" => ta.sma(source, length)
        "EMA" => ta.ema(source, length)
        "SMMA (RMA)" => ta.rma(source, length)
        "WMA" => ta.wma(source, length)
        "VWMA" => ta.vwma(source, length)

rsiLengthInput = input.int(14, minval=1, title="RSI Length", group="RSI Settings")
rsiSourceInput = input.source(close, "Source", group="RSI Settings")
maTypeInput = input.string("SMA", title="MA Type", options=["SMA", "Bollinger Bands", "EMA", "SMMA (RMA)", "WMA", "VWMA"], group="MA Settings")
maLengthInput = input.int(14, title="MA Length", group="MA Settings")
bbMultInput = input.float(1.8, minval=0.001, maxval=50, title="BB StdDev", group="MA Settings")
showDivergence = input.bool(false, title="Show Divergence", group="RSI Settings")

up = ta.rma(math.max(ta.change(rsiSourceInput), 0), rsiLengthInput)
down = ta.rma(-math.min(ta.change(rsiSourceInput), 0), rsiLengthInput)
rsi = down == 0 ? 100 : up == 0 ? 0 : 100 - (100 / (1 + up / down))
rsiMA = ma(rsi, maLengthInput, maTypeInput)
isBB = maTypeInput == "Bollinger Bands"


rsiMultiplier = rsi <= 50 ? rsi * 0.8 : rsi * 1.2

source = hlc3

mult = input.float(1.6, minval=0.001, maxval=50)
DrawRSI_f = input(false, title="Draw RSI?")
DrawMFI_f = input(true, title="Draw MFI?")
HighlightBreaches = input(true, title="Highlight Oversold/Overbought?")

DrawMFI = (not DrawMFI_f) and (not DrawRSI_f) ? true : DrawMFI_f
DrawRSI = (DrawMFI_f and DrawRSI_f) ? false : DrawRSI_f

// RSI
rsi_s = DrawRSI ? ta.rsi(source, length) : na


// MFI
upper_s = DrawMFI ? ta.sma(volume * (ta.change(source) <= 0 ? 0 : source), length) : na
lower_s = DrawMFI ? ta.sma(volume * (ta.change(source) >= 0 ? 0 : source), length) : na


// Draw BB on indices
bb_s = DrawRSI ? rsi_s : DrawMFI ? mf : na
basis = ta.sma(bb_s, length)
dev = mult * ta.stdev(bb_s, length)

upper = basis + dev
lower = basis - dev

//alerts and plots

alertcondition(((mf[1]<lower[1] and rsiMultiplier[1]<lower[1])and(ta.crossover(rsiMultiplier, lower))),"Buy")
alertcondition(((mf[1]<lower[1] and rsiMultiplier[1]<lower[1])and(ta.crossover(rsiMultiplier, lower))),"Sell")
alertcondition(((mf[1]<lower[1] and rsiMultiplier[1]<lower[1])and(ta.crossover(rsiMultiplier, lower))),"Sell without MFI")

plotshape(((mf[1]<lower[1] and rsiMultiplier[1]<lower[1])and(ta.crossover(rsiMultiplier, lower))),"Buy", style=shape.triangleup, location=location.belowbar, color=color.green, size=size.small)
plotshape(((mf[1]>upper[1] and rsiMultiplier[1]>upper[1])and(ta.crossunder(mf, upper))), "Sell MF",style=shape.triangledown, location=location.abovebar, color=color.red, size=size.small)
plotshape(((mf[1]>upper[1] and rsiMultiplier[1]>upper[1])and(ta.crossunder(rsiMultiplier, upper))), "Sell RSI",style=shape.triangledown, location=location.abovebar, color=color.red, size=size.small)
https://www.tradingview.com/script/G223gi3z/
Related

