
- เทคนิคของ Indicator:
- ผสมผสานการใช้งานของ Zigzag Trend Divergence Detector และ Divergence Goggles.
- ใช้งานกับ oscillators และตัวบ่งชี้แนวโน้มต่างๆ ได้อย่างยืดหยุ่น.
- ปรับค่า Zigzag ได้ตามความไวของ oscillator.
- ให้ตัวเลือกระหว่างสัญญาณที่มีการ repaint และสัญญาณที่มีความล่าช้า.
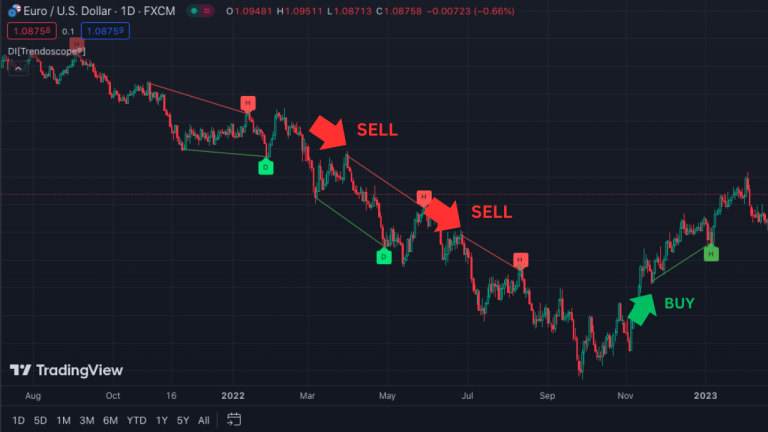
- บอกสัญญาณซื้อและขาย:
- ซื้อ: เมื่อมีการแสดงสัญญาณ Bullish Divergence หรือ Bullish Hidden Divergence.
- ขาย: เมื่อมีการแสดงสัญญาณ Bearish Divergence หรือ Bearish Hidden Divergence.
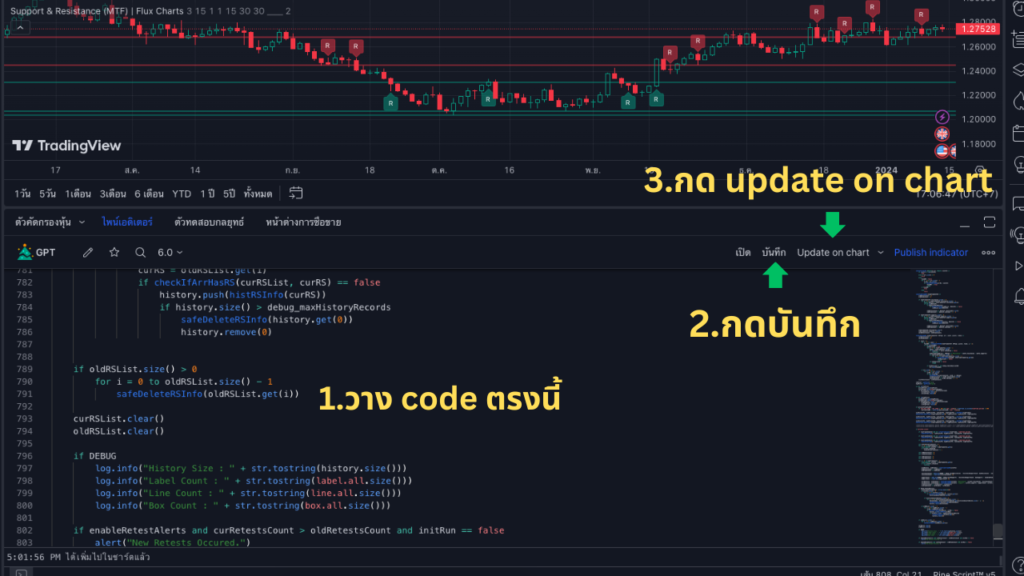
- ใช้งานในโปรแกรม TradingView https://www.tradingview.com/?aff_id=134641
- เปิดบัญชีทดลอง: การเริ่มต้นของ Passive Income https://bit.ly/3Sdkir2
// This work is licensed under Creative Commons Attribution-NonCommercial-ShareAlike 4.0 International License (CC BY-NC-SA 4.0) https://creativecommons.org/licenses/by-nc-sa/4.0/
// © Trendoscope
//                                       ░▒
//                                  ▒▒▒   ▒▒
//                              ▒▒▒▒▒     ▒▒
//                      ▒▒▒▒▒▒▒░     ▒     ▒▒
//                  ▒▒▒▒▒▒           ▒     ▒▒
//             ▓▒▒▒       ▒        ▒▒▒▒▒▒▒▒▒▒▒
//   ▒▒▒▒▒▒▒▒▒▒▒ ▒        ▒▒▒▒▒▒▒▒▒▒▒▒▒▒▒▒▒▒▒▒
//   ▒  ▒       ░▒▒▒▒▒▒▒▒▒▒▒▒▒▒▒▒▒▒▒▒▒▒▒▒▒▒▒▒▒░
//   ▒▒▒▒▒▒▒▒▒▒▒▒▒▒▒▒▒▒▒▒▒▒▒▒▒▒▒▒▒▒▒▒░▒▒▒▒▒▒▒▒
//   ▓▒▒▒▒▒▒▒▒▒▒▒▒▒▒▒▒▒▒▒▒ ▒▒
//    ▒▒▒▒▒         ▒▒▒▒▒▒▒
//                 ▒▒▒▒▒▒▒▒▒
//                ▒▒▒▒▒ ▒▒▒▒▒
//               ░▒▒▒▒   ▒▒▒▒▓      ████████╗██████╗ ███████╗███╗   ██╗██████╗  ██████╗ ███████╗ ██████╗ ██████╗ ██████╗ ███████╗
//              ▓▒▒▒▒     ▒▒▒▒      ╚══██╔══╝██╔══██╗██╔════╝████╗  ██║██╔══██╗██╔═══██╗██╔════╝██╔════╝██╔═══██╗██╔══██╗██╔════╝
//              ▒▒▒▒▒▒▒▒▒▒▒▒▒▒▒        ██║   ██████╔╝█████╗  ██╔██╗ ██║██║  ██║██║   ██║███████╗██║     ██║   ██║██████╔╝█████╗
//             ▒▒▒▒▒       ▒▒▒▒▒       ██║   ██╔══██╗██╔══╝  ██║╚██╗██║██║  ██║██║   ██║╚════██║██║     ██║   ██║██╔═══╝ ██╔══╝
//            ▒▒▒▒▒         ▒▒▒▒▒      ██║   ██║  ██║███████╗██║ ╚████║██████╔╝╚██████╔╝███████║╚██████╗╚██████╔╝██║     ███████╗
//             ▒▒             ▒
//@version=5
import HeWhoMustNotBeNamed/DrawingTypes/2 as dr
import HeWhoMustNotBeNamed/DrawingMethods/2
import HeWhoMustNotBeNamed/ZigzagTypes/5 as zg
import HeWhoMustNotBeNamed/ZigzagMethods/6
import HeWhoMustNotBeNamed/ta/1 as eta
indicator("Divergence Indicator [Trendoscope®]", 'DI[Trendoscope®]', overlay=true, max_lines_count = 500, max_labels_count = 500, max_polylines_count = 100)

oscillator(simple string type="rsi", simple int length=14, float source = close, float highSource = high, float lowSource = low)=>
    oscillator =  switch type
        "cci" => ta.cci(source, length)
    	"cmo" => ta.cmo(source, length)
    	"cog" => ta.cog(source, length)
    	"mfi" => ta.mfi(source, length)
    	"roc" => ta.roc(source, length)
    	"rsi" => ta.rsi(source, length)
    	"stoch" => ta.stoch(source, highSource, lowSource, length)
    	"wpr" => ta.wpr(length)
    	=> ta.rsi(source, length)

oscillatorType = input.string('rsi', 'Oscillator', ['rsi', 'cci', 'cmo', 'cog', 'mfi', 'roc', 'stoch', 'wpr'], inline='osc', group='Oscillator', display = display.none)
length = input.int(14, '',  group = 'Oscillator', inline='osc', tooltip = 'Built in Oscillator Type and Length', display = display.none)
useExternalOscillator = input.bool(false, 'Use External Oscillator', inline='eosc', group='Oscillator', display = display.none)
externalOscillator = input.source(close, '', 'Use external oscillator instead of the built ins', inline='eosc', group='Oscillator', display = display.none)

rsiColor = color.blue

trendTypeTooltip = 'Method to identify trend. \n'+
                         '\tZigzag - HH, HL on the starting pivot of divergence line is considered as uptrend and LL, LH on the starting pivot of divergence line is considered as downtrend\n'+
                         '\tMA Difference - Difference between moving average of divergence line pivot will define the trend\n'+
                         '\tExternal - Use External Oscillator Input'
trendMethod = input.string('Zigzag', 'Trend Detection Method', ['Zigzag', 'MA Difference', 'External'], group='Trend', display = display.none, tooltip=trendTypeTooltip)
maType = input.string('sma', 'MA Filter', ['sma', 'ema', 'rma', 'hma', 'wma', 'vwma'], inline='ma', group='Trend', display = display.none)
maLength = input.int(200, '', minval=5, step=50, inline='ma', group='Trend', display = display.none, tooltip='Moving Average to identify trend. Direction of moving average between the divergence pivots identify trend')
externalTrendSignal = input.source(close, 'External Trend Signal', 'Use External trend signal instead of the built in. The external indicator should return positive value for uptrend and negative value for downtrend', group='Trend', display = display.none)

zigzagLength = input.int(13, 'Length',  group = 'Zigzag', tooltip = 'Zigzag Length', display = display.none)

maxBars = input.int(5000, 'Calculation Bars', minval=500, maxval=100000, step=1000,
             tooltip = 'Number of bars to calculate divergence. Can increase load time by choosing lesser number of bars', group='Miscellaneous', display=display.none)
repaint = input.bool(false, 'Repaint',
             'If selected, divergence lines repaint as per the latest info. '+
             'If repaint is disabled, then the divergence is calculated based on confirmed pivots only. '+
             'Hence, the signals will be delayed till the pivot is confirmed.', group='Miscellaneous', display = display.none)

bullishDivergenceAlert = input.bool(true, 'Bullish Divergence', 'Alert on bullish divergence', group='Alerts', display = display.none)
bullishHiddenDivergenceAlert = input.bool(true, 'Bullish Hidden Divergence', 'Alert on bullish hidden divergence', group='Alerts', display = display.none)
bearishDivergenceAlert = input.bool(true, 'Bearish Divergence', 'Alert on bearish divergence', group='Alerts', display = display.none)
bearishHiddenDivergenceAlert = input.bool(true, 'Bearish Hidden Divergence', 'Alert on bearish hidden divergence', group='Alerts', display = display.none)

textColor = chart.bg_color

trendMethodInt = trendMethod == 'Zigzag' ? 1 : trendMethod == 'External' ? 3 : 2
var map<int, float> priceMap = map.new<int,float>()
var map<int, float> oscillatorMap = map.new<int, float>()
priceMap.put(bar_index, close)

type ZigzagDrawing
    array<label> pivotLabels
    array<line> divergenceLines
    array<chart.point> pricePoints
    polyline priceLine

type ZigzagProperties
    color textColor = color.black
    int trendMethod = 1
    bool repaint = false

const array<float> allowedDivergenceTypes = array.from(bullishDivergenceAlert?1.0:0.0, bullishHiddenDivergenceAlert?2.0:0.0, bearishDivergenceAlert?-1.0:0.0, bearishHiddenDivergenceAlert?-2.0:0.0)
getColor(dir, ratio)=>dir > 0? (ratio > 1 ? color.green : color.orange) : (ratio > 1 ? color.red : color.lime)
getText(dir, ratio)=>dir > 0? (ratio > 1 ? 'HH' : 'LH') : (ratio > 1 ? 'LL' : 'HL')
method drawcontinuous(zg.Zigzag this, ZigzagProperties properties)=>
    var drawing = ZigzagDrawing.new(array.new<label>(), array.new<line>(), array.new<chart.point>())
    startIndex = properties.repaint? 0 : 1
    if(this.zigzagPivots.size() > 2+startIndex)
        lastPivot = this.zigzagPivots.get(startIndex)
        llastPivot = this.zigzagPivots.get(startIndex+2)
        skip = false
        if(this.flags.updateLastPivot)
            if(drawing.divergenceLines.size() > 0)
                lastDivergenceLine = drawing.divergenceLines.last()
                divergenceStartBar = lastDivergenceLine.get_x2()
                llastPivotBar = llastPivot.point.bar

                divergenceEndBar = lastDivergenceLine.get_x1()
                lastPivotBar = lastPivot.point.bar
                if(llastPivotBar == divergenceStartBar and lastPivotBar > divergenceEndBar)
                    drawing.divergenceLines.pop().delete()
                    drawing.pivotLabels.pop().delete()
                skip := llastPivotBar == divergenceStartBar and lastPivotBar == divergenceEndBar

        if(this.flags.newPivot and not skip)

            dir = math.sign(lastPivot.dir)
            lastOsc = lastPivot.point.price
            lastPrice = lastPivot.indicatorValues.get(0)
            oscRatio = lastPivot.ratio
            priceRatio = lastPivot.indicatorRatios.get(0)

            priceLblColor = getColor(lastPivot.dir, priceRatio)
            priceLblText = getText(lastPivot.dir, priceRatio)

            oscLblColor = getColor(lastPivot.dir, oscRatio)
            oscLblText = getText(lastPivot.dir, oscRatio)

            lastTrend = lastPivot.indicatorValues.get(2)
            lastMa =  lastPivot.indicatorValues.get(1)

            pricePoint = chart.point.new(lastPivot.point.bartime, lastPivot.point.bar, lastPrice)
            oscillatorPoint = chart.point.new(lastPivot.point.bartime, lastPivot.point.bar, lastPivot.point.price)

            if(priceLblColor != oscLblColor and llastPivot.indicatorRatios.size() > 0)
                llastPrice = llastPivot.indicatorValues.get(0)
                llastRatio = llastPivot.indicatorRatios.get(0)
                llastMa = llastPivot.indicatorValues.get(1)
                lastPricePoint = chart.point.new(llastPivot.point.bartime, llastPivot.point.bar, llastPrice)
                llastOscillatorPoint = chart.point.new(llastPivot.point.bartime, llastPivot.point.bar, llastPivot.point.price)

                sentiment = math.sign(oscRatio - priceRatio)
                trend = properties.trendMethod == 3? math.sign(lastTrend) :
                         properties.trendMethod == 1? math.sign(dir*(llastRatio-1)) :
                         math.sign(llastMa-lastMa)

                divergence = (trend == dir and sentiment < 0)? 1 : (trend != dir and sentiment > 0) ? -1 : 0
                if(divergence != 0)
                    divergenceText = (dir > 0? 'Bearish' : 'Bullish')+(divergence>0?'Divergence':'Hidden Divergence')
                    divergenceColor = dir > 0? color.red : color.green
                    priceDivergenceLine = line.new(pricePoint, lastPricePoint, xloc.bar_index, extend.none, divergenceColor)
                    oscillatorDivergenceLine = line.new(oscillatorPoint, llastOscillatorPoint, xloc.bar_index, extend.none, divergenceColor)

                    validDivergence = true
                    for bar = lastPricePoint.index+1 to pricePoint.index-1
                        priceAtBar = priceMap.get(bar)
                        oscillatorAtBar = oscillatorMap.get(bar)
                        if(priceAtBar*dir > priceDivergenceLine.get_price(bar)*dir) or (oscillatorAtBar*dir >oscillatorDivergenceLine.get_price(bar)*dir)
                            validDivergence := false
                            break
                    oscillatorDivergenceLine.delete()
                    if(validDivergence)
                        drawing.divergenceLines.push(priceDivergenceLine)
                        priceLblSize = size.small
                        priceLblText := divergence >0 ? 'D' : 'H'
                        divergenceTypeText = (dir > 0? 'Bearish' : 'Bullish') + ' ' + (divergence >0 ? 'Divergence' : 'Hidden Divergence')
                        priceTooltipText = divergenceTypeText + '\nPrice : '+str.tostring(lastPrice) + ' ( '+str.tostring(priceRatio)+' ) - ' + priceLblText + '\n' +
                                                 'Oscillator :'+str.tostring(lastMa) + ' ( '+str.tostring(oscRatio)+' ) - ' + oscLblText
                        priceLblStyle = dir > 0? label.style_label_down : label.style_label_up
                        priceLblColor := divergence >0 ? (dir > 0? color.orange : color.lime) : (dir > 0? color.red : color.green)
                        priceDivergenceLabel = label.new(pricePoint, priceLblText, xloc.bar_index, yloc.price, priceLblColor,
                                                         priceLblStyle, properties.textColor, priceLblSize, tooltip = priceTooltipText)
                        drawing.pivotLabels.push(priceDivergenceLabel)
                        divergenceType = (divergence > 0? 1 : 2)*-dir
                        if(allowedDivergenceTypes.includes(divergenceType))
                            alert('Alert : '+ priceTooltipText, alert.freq_once_per_bar_close)
                        true
                    else
                        priceDivergenceLine.delete()
                        false

ma = eta.ma(close, maType, maLength)
oscillator = useExternalOscillator? externalOscillator : oscillator(oscillatorType, length)
if(bar_index >= last_bar_index-maxBars)
    oscillatorMap.put(bar_index, oscillator)
    indicators = matrix.new<float>()
    indicatorNames = array.from('Price', maType+str.tostring(maLength), 'External Trend')

    indicators.add_row(0, array.from(close, close, close))
    indicators.add_row(1, array.from(ma, ma, ma))
    indicators.add_row(2, array.from(externalTrendSignal, externalTrendSignal, externalTrendSignal))

    var zg.Zigzag zigzag = zg.Zigzag.new(zigzagLength, 300, 0)
    var ZigzagProperties properties = ZigzagProperties.new(textColor, trendMethodInt, repaint)
    zigzag.calculate(array.from(oscillator), indicators, indicatorNames)
    zigzag.drawcontinuous(properties)
https://www.tradingview.com/script/RrPXoLMa-Divergence-Indicator-Trendoscope/