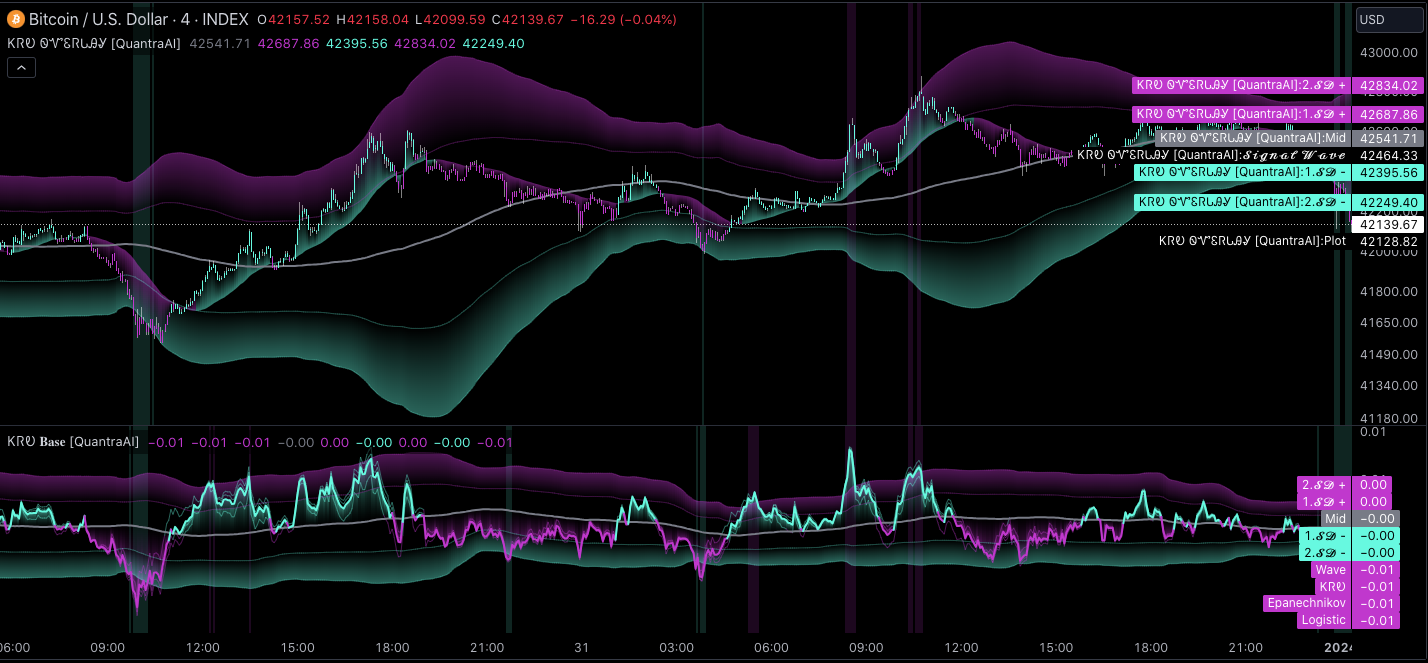

- เทคนิคของ Indicator:
- ใช้การผสมผสานของสาม Kernel Regressions ที่แตกต่างกันใน Oscillator.
- ประกอบด้วย Epanechnikov Kernel Regression, Wave Kernel Regression, และ Logistic Kernel Regression.
- มี Overlay และ Base Chart เพื่อแสดงทิศทางและโซน Oversold และ Overbought.
- บอกสัญญาณซื้อและขาย:
- ซื้อ: เมื่อทั้ง Overlay และ Base Chart อยู่ในโซน Oversold, แสดงโอกาสสูงของการกลับตัวของแนวโน้ม.
- ขาย: เมื่อทั้ง Overlay หรือ Base Chart อยู่ในโซน Overbought, แสดงโอกาสสูงสำหรับการอ่อนแอของแนวโน้มหรือการกลับตัว.
- ใช้งานในโปรแกรม TradingView https://www.tradingview.com/?aff_id=134641
- เปิดบัญชีทดลอง: การเริ่มต้นของ Passive Income https://bit.ly/3Sdkir2
kernel(source, bandwidth, kernel_type) =>
    switch kernel_type
        "Epanechnikov" => math.abs(source) <= 1 ? 0.75 * (1 - math.pow(source, 2)) : 0.0
        "Logistic"          => 1/math.exp(source + 2 + math.exp(-source))
        "Wave"             => math.abs(source) <= 1 ? (1 - math.abs(source)) * math.cos(math.pi * source) : 0.

kernelRegression(src, bandwidth, kernel_type) =>
    sumWeightedY = 0.
    sumKernels = 0.
    for i = 0 to bandwidth - 1
        base = i*i/math.pow(bandwidth, 2)
        kernel = kernel(base, 1, kernel_type)
        sumWeightedY += kernel * src[i]
        sumKernels   += kernel
    (src - sumWeightedY/sumKernels)/src

// Triple Confirmations
Ep = kernelRegression(source, bandwidth, 'Epanechnikov' )
Lo = kernelRegression(source, bandwidth, 'Logistic'     )
Wa = kernelRegression(source, bandwidth, 'Wave'         )
https://www.tradingview.com/script/QbkEr6o9-Triple-Confirmation-Kernel-Regression-Overlay-QuantraAI/
