
- เทคนิคของ Indicator:
- ใช้ EMA (Exponential Moving Average) เพื่อทำให้ข้อมูลเรียบง่ายและชี้วัดทิศทาง.
- ใช้ ATR (Average True Range) เป็นส่วนหลักในการคำนวณ.
- จับตาจุดที่ตลาดอาจมีการรวมตัว (squeeze) และการแตกตัว (release).
- มีการตรวจจับ “Hyper Squeeze” เพื่อระบุจุดที่มีความผันผวนต่ำอย่างมาก.
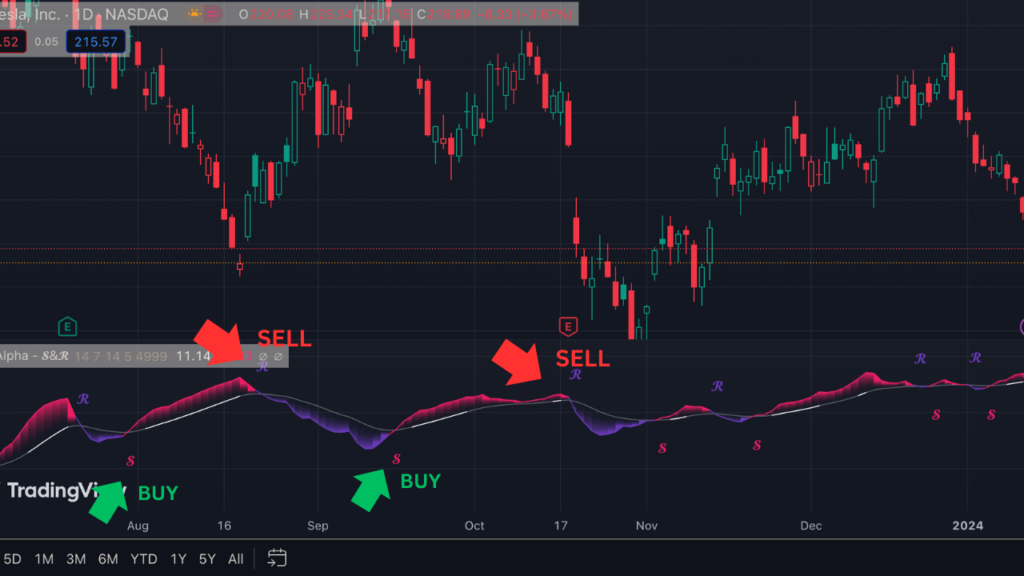
- บอกสัญญาณซื้อและขาย:
- ซื้อ: ในสถานการณ์การรวมตัว (squeeze), ซึ่งอาจบ่งบอกถึงการกำลังจะเกิดการระเบิดของราคา.
- ขาย: ในสถานการณ์การแตกตัว (release), ซึ่งอาจบ่งบอกถึงการลดลงของราคา.
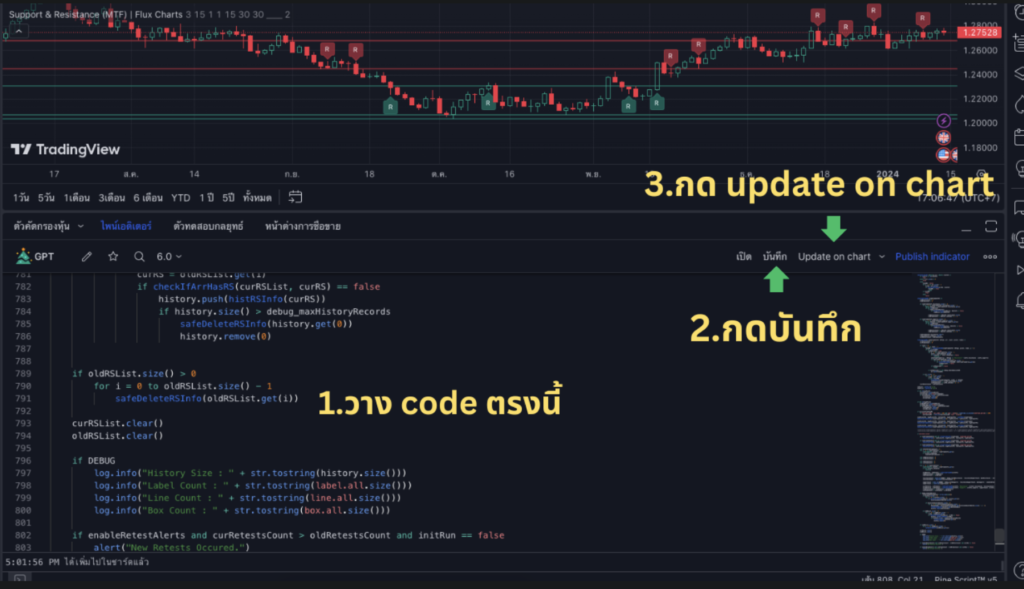
- ใช้งานในโปรแกรม TradingView https://www.tradingview.com/?aff_id=134641
- เปิดบัญชีทดลอง: การเริ่มต้นของ Passive Income https://bit.ly/3Sdkir2
// This Pine Script™ code is subject to the terms of the Mozilla Public License 2.0 at https://mozilla.org/MPL/2.0/
// © AlgoAlpha

//@version=5
indicator(title="Squeeze & Release [AlgoAlpha]", shorttitle="AlgoAlpha - 𝓢&𝓡", overlay=false, timeframe="", timeframe_gaps=true)

// Input definitions for user configuration
periodForCalculation = input.int(title="Calculation Period", defval=14, minval=1)
lengthForSmoothing = input.int(title="Smoothing Length", defval=7, minval=1)
lengthForEMA = input.int(title="EMA Length", defval=14, minval=1)
lengthForHyperSqueezeDetection = input.int(title="Hyper Squeeze Detection Length", defval=5, minval=1)
standarddeviationlength = input.int(title="standard deviation Length", defval=4999, minval=2, maxval = 4999)
showbands = input.bool(true, "Show Deviation Bands")
enableSmoothing = input.bool(true, "Enable Smoothing")
colorForRelease = input.color(#673ab7, "Release Color")
colorForSqueeze = input.color(#e91e63, "Squeeze Color")

// Calculating ATR and its EMA
averageTrueRange = ta.ema(ta.tr(true), periodForCalculation)
emaOfATR = ta.ema(averageTrueRange, periodForCalculation * 2)
volatilityIndicator = emaOfATR - averageTrueRange

// Calculating SV (Squeeze Value) and SVMA (Squeeze Value Moving Average)
emaHighLowDifference = ta.ema(high - low, periodForCalculation * 2)
squeezeValue = enableSmoothing ? ta.ema(volatilityIndicator / emaHighLowDifference * 100, lengthForSmoothing) : volatilityIndicator / emaHighLowDifference * 100
squeezeValueMA = ta.ema(squeezeValue, lengthForEMA)

// Plotting the main lines
movingAverageLine = plot(squeezeValueMA, color=squeezeValue > 0 and ta.rising(squeezeValue, lengthForHyperSqueezeDetection) ? color.white : color.new(color.white, 70))
valueLine = plot(squeezeValue, title="ATR", color=squeezeValue > squeezeValueMA ? color.new(colorForSqueeze, 0) : color.new(colorForRelease, 0))

// Plotting characters for Squeeze and Release
plotchar(ta.crossover(squeezeValue, squeezeValueMA) ? squeezeValueMA - 10 : na, title="Squeeze", char="𝓢", location=location.absolute, color=colorForSqueeze, size=size.tiny)
plotchar(ta.crossunder(squeezeValue, squeezeValueMA) ? squeezeValueMA + 10 : na, title="Release", char="𝓡", location=location.absolute, color=colorForRelease, size=size.tiny)

// Filling between MA and Value
fillColorBetweenLines = squeezeValue > squeezeValueMA ? color.new(colorForSqueeze, 0) : color.new(colorForRelease, 0)
fill(movingAverageLine, valueLine, squeezeValue, squeezeValueMA, fillColorBetweenLines, color.new(chart.bg_color, 100))

meanValue = ta.cum(squeezeValue)/bar_index
standardDeviation = ta.stdev(squeezeValue, standarddeviationlength, true)

thresholdUp = math.max(((squeezeValue-meanValue)/(2*standardDeviation)) * 100, 70)
thresholdDown = math.max(((meanValue-squeezeValue)/(2*standardDeviation)) * 100, 70)

upperLimit = plot(meanValue+standardDeviation, display = display.none)
lowerHigh = plot(meanValue-standardDeviation, display = display.none)
upperHigh = plot(meanValue + 2*standardDeviation, display = display.none)
lowerLimit = plot(meanValue - 2*standardDeviation, display = display.none)

fill(upperLimit, upperHigh, color = color.from_gradient(squeezeValue, -30, 30, color.new(colorForSqueeze, thresholdUp), color.new(colorForRelease, thresholdUp)), display = showbands ? display.all : display.none)
fill(lowerLimit, lowerHigh, color = color.from_gradient(squeezeValue, -30, 30, color.new(colorForSqueeze, thresholdDown), color.new(colorForRelease, thresholdDown)), display = showbands ? display.all : display.none)

alertcondition(ta.crossover(squeezeValue, squeezeValueMA), "Squeeze", "🚨Squeeze!")
alertcondition(ta.crossunder(squeezeValue, squeezeValueMA), "Release", "🚨Release!")
alertcondition(squeezeValue > 0 and ta.rising(squeezeValue, lengthForHyperSqueezeDetection), "Hyper Squeeze", "Hyper Squeeze!")
https://www.tradingview.com/script/2rpsjnzA-Squeeze-Release-AlgoAlpha/