//@version=5
//@author Eugene
//
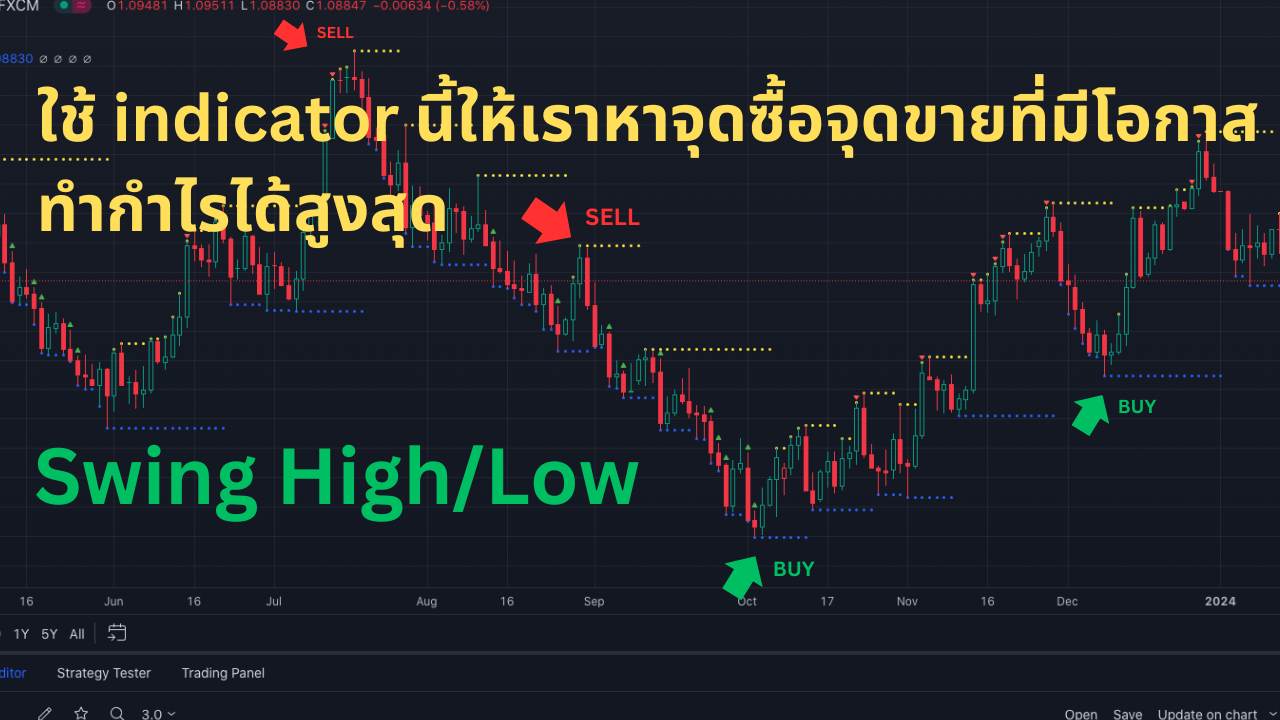
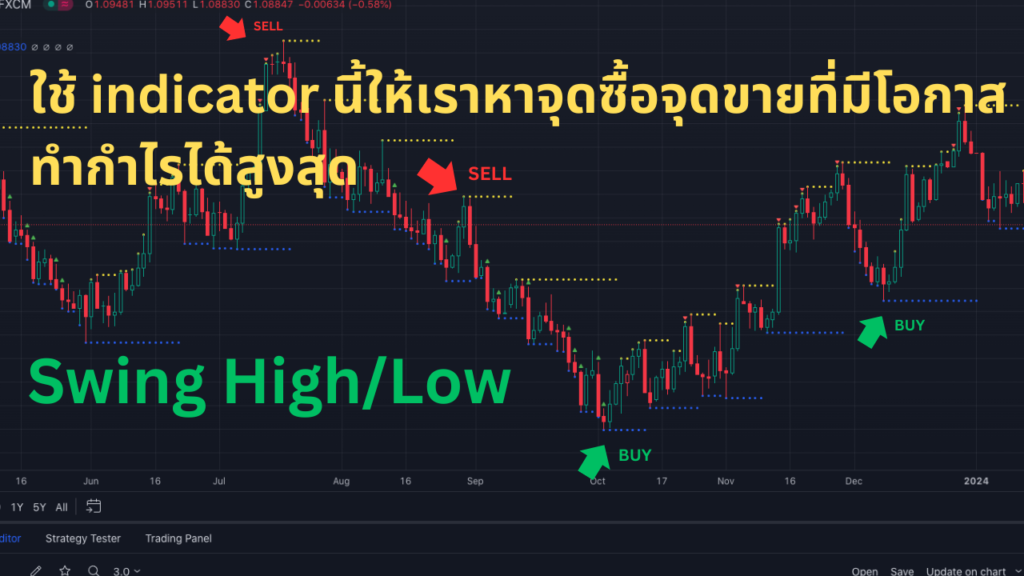
// HOLP (High of the low period) and LOHP (Low of the high period)
// Catching Trend Reversals by shorting tops and buying bottoms
// using this Swing High/Low Indicator
//
// Trading Strategy comes from Mastering the Trade, by John Carter pg 300.
// Trading Rules for Sells, Buys are reversed
//
// 1. Identifying a trending market, where today's price is making a 20-day high (17-18 day highs are also fine)
// Note this is configurable by setting the trending period variable (defaults to 20)
// For example if price is making a 20 period high or 20 period low, it will show a triangle up/down above the candle.
// 2. Identify the high bar in the uptrend
// 3. Go short once the price action closes below the low of this high bar
// 4. The intial stop is the high of the high bar.
// 5. If you are in the trade on the third day or period, use a 2 bar trailing stop.
// You can check 2-bar trailing stop to draw the line, defaults to off.
// Stop is indicated by the white dot.
//
// Code Converted from TradeStation EasyLanguage
// I can't find the original source anymore for the swing high/low plots, but if someone knows,
// let me know and I'll credit here.
//
indicator(shorttitle='HOLP/LOHP', title='Catching Trend Reversals by shorting tops and buying bottoms', overlay=true)
bartype() =>
if timeframe.period == "D"
2
else if timeframe.period == "W"
3
else if timeframe.period == "M"
4
else
1
barinterval() =>
timeframe.multiplier
fPushPeriods(iInterval) =>
if iInterval < 5
60
else if iInterval < 10
45
else if iInterval == 10
6
else if iInterval == 15
12
else if iInterval == 30
4
else if iInterval == 60
6
else if iInterval > 60
10
var iMode = "Yes"
var iPeriods = input.int(5, 'Periods')
var highColor = input.color(color.red, 'high color')
var lowColor = input.color( color.blue, 'low color')
var trendingPeriod = input.int(20, 'Trending Period (shows triangleup or triangledown if price is making this period high/low)')
var showShortStop = input.bool(false, '2 bar trailing stop when shorting')
var showLongStop = input.bool(false, '2 bar trailing stop when buying (going long)')
var xPeriods = 60
var xInterval = 0
var sFirstPass = true
var havePrevLines = false
var tLHigh = 0.0
var tLLow = 0.0
var pushHigh = 0.0
var pushHighBar = 0
var pushLow = 0.0
var pushLowBar = 0
var oldPushHigh = 0.0
var oldPushLow = 0.0
var prevPushHigh = 0.0
var prevPushLow = 0.0
var K = 0.0
var R = 0.0
var H0C1 = 0.0
var L0C1 = 0.0
var H0L0 = 0.0
var C1O1 = 0.0
var DL = 1.0
var SI =0.0
var ASI = 0.0
var SLOW_K =0.0
var SLOW_D = 0.0
var SWING_HIGH = 0.0
var SWING_LOW = 0.0
H0C1 := math.abs(high - close[1] )
L0C1 := math.abs( low - close[1] )
H0L0 := high - low
C1O1 := math.abs(close[1] - open[1] )
if H0C1 >= L0C1
K := H0C1
if H0C1 >= H0L0
R := H0C1 - 0.5 * L0C1 + 0.25 * C1O1
else
R := H0L0 + 0.25 * C1O1
else
K := L0C1
if L0C1 >= H0L0
R := L0C1 - 0.5 * H0C1 + 0.25 * C1O1
else
R := H0L0 + 0.25 * C1O1
if R != 0
SI := 50 * ( ( ( close - close[1] ) + 0.50 * ( close - open ) + 0.25 * ( close[1] - open[1] ) ) / R ) * K / DL
else
SI := 0
ASI := ASI + SI
if sFirstPass
sFirstPass := false
if bartype() == 4 // monthly
xInterval := 94
else if bartype() == 3 // weekly
xInterval := 93
else if bartype() == 2 // daily
xInterval := 92
else if bartype() == 1 // minute
xInterval := barinterval()
if iMode != "Auto" and iMode != "auto" and iMode != "AUTO"
xPeriods := iPeriods
else
xPeriods := fPushPeriods(xInterval)
if pushHigh != prevPushHigh
oldPushHigh := prevPushHigh
if pushLow != prevPushLow
oldPushLow := prevPushLow
oldPushHigh := prevPushHigh
oldPushLow := prevPushLow
prevPushHigh := pushHigh
prevPushLow := pushLow
pushHigh := ta.highest(high, xPeriods)
pushLow := ta.lowest(low, xPeriods)
var lowBreakout = 0.0
var highBreakout = 0.0
var pushBar = 0
if pushHigh != high and pushHigh < prevPushHigh
pushHigh := prevPushHigh
if pushLow != low and pushLow > prevPushLow
pushLow := prevPushLow
if pushHigh != pushHigh[1]
lowBreakout := low
if pushLow != pushLow[1]
highBreakout := high
var stop = 0.0
var prevHighBreakout = 0.0
var entry = 0.0
plot(pushHigh, "PushHigh", color.yellow, style=plot.style_circles)
plot(pushLow, "PushLow", color.blue, style=plot.style_circles)
plotshape(close >= ta.highest(trendingPeriod)[1] ? close : na, style=shape.triangledown, location=location.abovebar, color=color.red)
plotshape(close <= ta.lowest(trendingPeriod)[1] ? close : na, style=shape.triangleup, location=location.abovebar, color=color.green)
plot(showShortStop ? ta.highest(2)[1] : na, color=color.white, style=plot.style_cross)
plot(showLongStop ? ta.lowest(2)[1] : na, color=color.white, style=plot.style_cross)