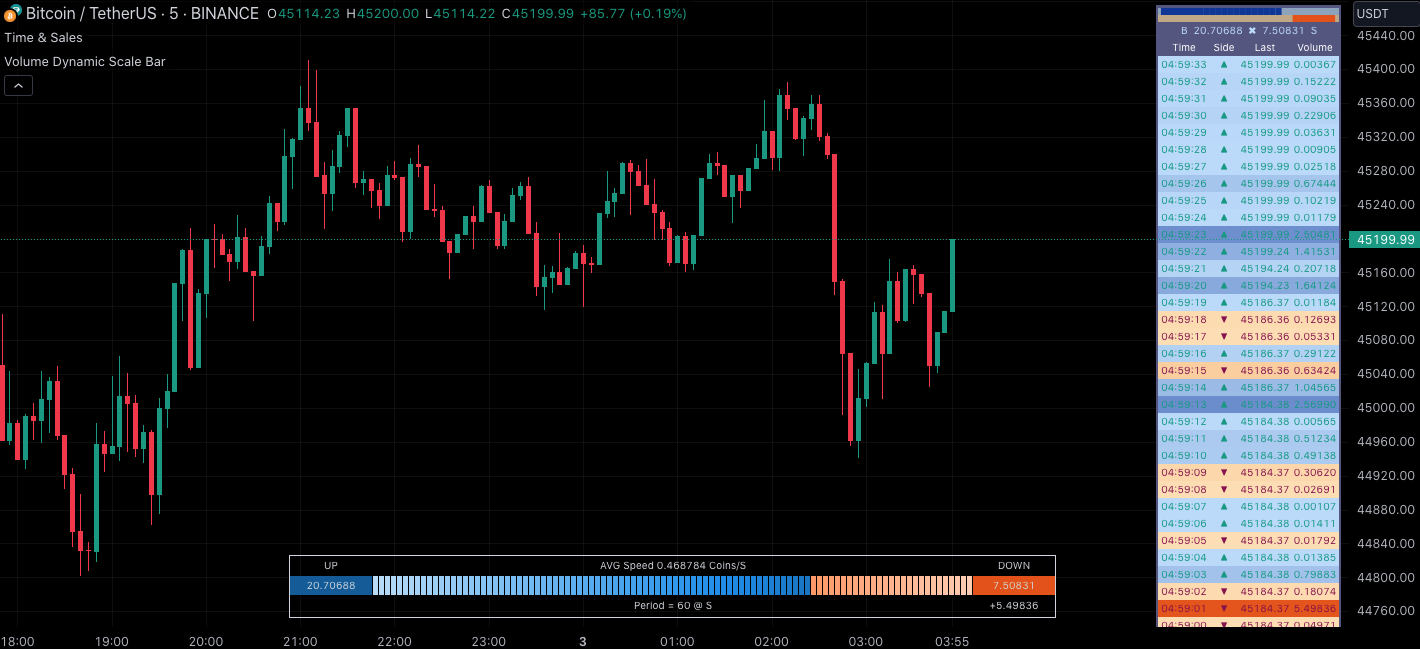
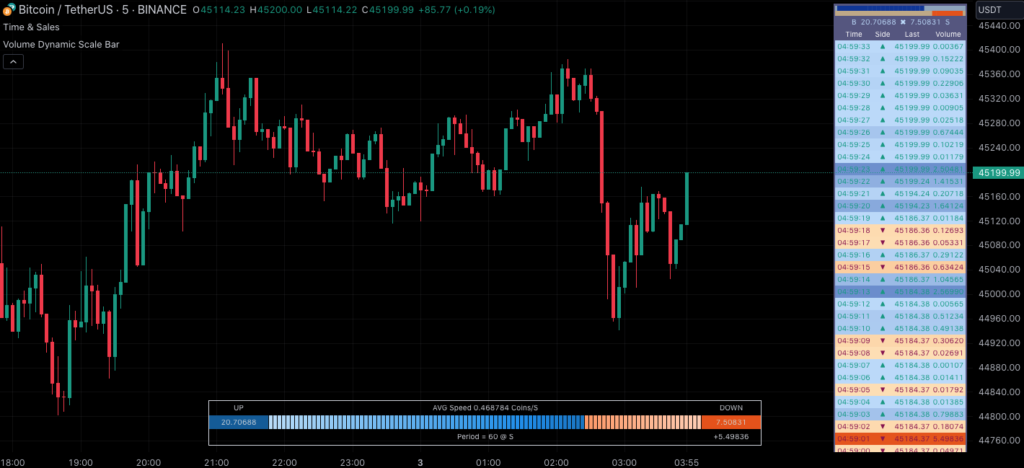
- เทคนิคของ Indicator:
- วัดความโดดเด่นของการไหลของปริมาณการซื้อขายในช่วงเวลาที่เลือก.
- ตรวจจับความเร็วเฉลี่ยของการไหลของปริมาณการซื้อขาย.
- คล้ายกับ Time & Sales (Tape).
- บอกสัญญาณซื้อและขาย:
- ไม่ได้ระบุชัดเจน แต่ช่วยให้เห็นว่าใครกำลังควบคุมตลาดระหว่างผู้ซื้อและผู้ขาย.
- สามารถใช้เพื่อตรวจจับการเคลื่อนไหวของปริมาณการซื้อขายที่สำคัญ.
- ใช้งานในโปรแกรม TradingView https://www.tradingview.com/?aff_id=134641
- เปิดบัญชีทดลอง: การเริ่มต้นของ Passive Income https://bit.ly/3Sdkir2
// This Pine Script™ code is subject to the terms of the Mozilla Public License 2.0 at https://mozilla.org/MPL/2.0/
// © MUQWISHI

//@version=5
indicator("Volume Dynamic Scale Bar", overlay = true)

// |++++++++++++++++++++++++++++++++++++++++++++++++++++++++++++++++++++++++++++|
// |                                   INPUT                                    |
// |++++++++++++++++++++++++++++++++++++++++++++++++++++++++++++++++++++++++++++|
// +++++++++++++++ Table Settings
var G1 = "Table Settings"
// Timezone
timzon = input.string("GMT-5", "Timezone  ", inline = "0", group = G1)

// Location
tablePos = input.string("Bottom Center", "Table Location | Size",
             ["Top Right" , "Middle Right"  , "Bottom Right" ,
              "Top Center", "Middle Center" , "Bottom Center",
              "Top Left"  , "Middle Left"   , "Bottom Left" ], inline = "1", group = G1)

// Size
tableSiz = input.string("Small", "",
             ["Auto", "Huge", "Large", "Normal", "Small", "Tiny"], inline = "1", group = G1)

// Cell Colors
upXCC = input.color(#0c5a99, "Up | Down Volume       ",       group = G1, inline = "4")
dnXCC = input.color(#E65100, "",                              group = G1, inline = "4")
clrMd = input.string("Gradient", "    ", ["Solid", "Gradient"], group = G1, inline = "4")

// Flash
cFlsh = input.bool(true, "Enable 3-Seconds Flash When Volume Is More")
vFlsh = input.float(8,   "          Than X of The Average", 1, 100, inline = "5",
         tooltip = "   2 → double average.\n   3 → triple average.\n10 → 10 times average.\n...etc")


// +++++++++++++++ Technical Settings
tFrm = input.timeframe("1S", "Lower Timeframe",  group = "Technical Settings",
         tooltip = "Note:\nIf the selected timeframe is invalid (higher than chart), the indicator will automatically switch to 1 second.")

nRow = input.int(60, "Length", 1, 100, group = "Technical Settings") + 2

iVol = input.string("Volume", "Size Type", ["Volume", "Price Volume"], group = "Technical Settings")


// |++++++++++++++++++++++++++++++++++++++++++++++++++++++++++++++++++++++++++++|
// |                                 CALCULATION                                |
// |++++++++++++++++++++++++++++++++++++++++++++++++++++++++++++++++++++++++++++|
// +++++++++++++++ Get Number of Strings Function
strVol (x) => str.tostring(x, format.volume)
strPvol(x) => str.tostring(x, "$##.00")
strTik (x) => str.tostring(x, format.mintick)

// +++++++++++++++ Declare Matrix
var mtx = matrix.new<float>(0, 5, na) // Lower Timeframe

// +++++++++++++++ Import Data
var timfram =  timeframe.in_seconds(tFrm) > timeframe.in_seconds(timeframe.period) ? "1S" : tFrm
[cls, tim, vol, sBr] = request.security_lower_tf(syminfo.tickerid, timfram,
     [close, time, iVol == "Volume" ? volume : hlc3 * volume, session.isfirstbar ? 1 : 0], true, ignore_invalid_timeframe = true)

var chg = 0
if cls.size() > 0 and cls.size() == tim.size() and cls.size() == vol.size()

    sIdx = cls.size() - nRow < 0 ? 0 : cls.size() - nRow
    eIdx = cls.size()

    tim0 = tim.slice(sIdx, eIdx)
    vol0 = vol.slice(sIdx, eIdx)
    cls0 = cls.slice(sIdx, eIdx)
    sBr0 = sBr.slice(sIdx, eIdx)

    for i = 0 to cls0.size() - 1
        cTim = tim0.get(i)
        cVol = vol0.get(i)
        cCls = cls0.get(i)
        csBr = sBr0.get(i)

        if mtx.rows() > 0
            // Price Change
            pCls = mtx.get(0, 2)
            if pCls != cCls
                chg := (cCls - pCls)/pCls > 0 ? 1 : -1

        // Add new rows with values to Matrix
        mtx.add_row(0, array.from(cTim, chg, cCls, cVol, csBr))

        // Remove over rows from a Matrix
        while mtx.rows() > nRow
            mtx.remove_row(mtx.rows()-1)

// |++++++++++++++++++++++++++++++++++++++++++++++++++++++++++++++++++++++++++++|
// |                                   TABLE                                    |
// |++++++++++++++++++++++++++++++++++++++++++++++++++++++++++++++++++++++++++++|
// +++++++++++++++ Get Tbale Location & Size
locNsze(x) =>
    y   = str.split(str.lower(x), " ")
    out = ""
    for i = 0 to y.size() - 1
        out := out + y.get(i)
        if i != y.size() - 1
            out := out + "_"
    out

// +++++++++++++++ Get Volume Format
volForm(x) =>
    iVol == "Volume" ? x > 999999 ? strVol(x) : str.tostring(x) : strPvol(x)

// +++++++++++++++ Get Timeframe Format
tfTxt(x) =>
    out = x
    if not str.contains(x, "S") and not str.contains(x, "M") and
       not str.contains(x, "W") and not str.contains(x, "D")
        if str.tonumber(x) % 60 == 0
            out := str.tostring(str.tonumber(x)/60)+"H"
        else
            out := x + "min"
    else
        out := x

    if (str.length(out) == 2 and str.contains(out, "1")) or str.contains(out, "1min")
        out := str.split(out, "1").get(0)
    else
        out := out

// +++++++++++++++ Get Speed Info
speed(x1, x2) =>
    var unit = if iVol == "Price Volume"
        "/"
    else
        switch syminfo.type
            "stock"  => " Shares/"
            "dr"     => " Shares/"
            "fund"   => " Shares/"
            "crypto" => " Coins/"
            => " Units/"

    varip spMin = 0.0
    varip spMax = 0.0
    varip spTim = timenow

    speed = barstate.isrealtime ? x1/x2 : 0

    spMin := spMin == 0 ? speed : math.min(speed, spMin)
    spMax := spMax == 0 ? speed : math.max(speed, spMax)

    [volForm(math.round(speed, 6)) + unit + tfTxt(timfram),
     volForm(math.round(spMin, 6)) + unit + tfTxt(timfram),
     volForm(math.round(spMax, 6)) + unit + tfTxt(timfram),
     str.format_time(spTim, "HH:mm:ss  yyyy-MM-dd", timzon)]

// +++++++++++++++ Get Dynamic Scale Bar Color
colorLab(col, z) =>
    R = color.r(col), G = color.g(col),  B = color.b(col)

    //  RGB TO HSL
    r1 = R / 255, g1 = G / 255, b1 = B / 255

    cMax = math.max(r1, g1, b1)
    cMin = math.min(r1, g1, b1)
    dlta = cMax - cMin

    h = 0.0
    if dlta != 0
        if cMax == r1
            h := ((g1 - b1) / dlta) % 6
        else if cMax == g1
            h := (b1 - r1) / dlta + 2
        else if cMax == b1
            h := (r1 - g1) / dlta + 4

        h := h < 0 ? (h * 60) + 360 : h * 60

    l = (cMax + cMin) / 2
    s = dlta != 0 ? dlta / (1 - math.abs(2 * l - 1)) : 0.0

    // * Update Lightness *
    l := (85 - 60.0/100.0 * z)/100
    l := l > 1 ? 1 : l < -1 ? -1 : l

    // HSL TO RGB
    c = (1 - math.abs(2 * l - 1)) * s
    x = c * (1 - math.abs((h / 60) % 2 - 1))
    m = l - c / 2

    r2 = 0.0, g2 = 0.0, b2 = 0.0
    if h >= 0 and h < 60
        r2 := c, g2 := x, b2 := 0
    else if h >= 60 and h < 120
        r2 := x, g2 := c, b2 := 0
    else if h >= 120 and h < 180
        r2 := 0, g2 := c, b2 := x
    else if h >= 180 and h < 240
        r2 := 0, g2 := x, b2 := c
    else if h >= 240 and h < 300
        r2 := x, g2 := 0, b2 := c
    else if h >= 300 and h < 360
        r2 := c, g2 := 0, b2 := x

    color.rgb((r2 + m) * 255, (g2 + m) * 255, (b2 + m) * 255)

sColor(col)=>
    var out = array.new<color>(100, col)
    if clrMd == "Gradient"
        for i = 0 to out.size() - 1
            array.set(out, i, colorLab(col, i))
    out

// +++++++++++++++ Create Table
var table tbl = na
if mtx.rows() > 2
    tbl := table.new(locNsze(tablePos), 102, 4, color(na),
           color.new(chart.fg_color, 0), 1, color.new(#000000, 100), 1)

// +++++++++++++++ Get Cell Function
cell(col, row, txt, w, h, color, txtCol) =>
    tbl.cell(col, row, txt, w, h, txtCol, bgcolor = color, text_size = locNsze(tableSiz))

// +++++++++++++++ Draw Table
if barstate.islast and not na(tbl)
    table.clear(tbl, 0, 0, 101, 3)

    upVol = .0
    dnVol = .0
    for i = 0 to mtx.rows() - 3
        if mtx.get(i, 1) > 0
            upVol += mtx.get(i, 3)
        else
            dnVol += mtx.get(i, 3)

    span  = (timenow - mtx.get(mtx.rows()-3, 0))/(1000 * timeframe.in_seconds(tFrm))
    smVol = upVol + dnVol
    avVol = smVol/(mtx.rows() - 2)


    // Up & Down Volumes Columns
    cell(0,   3, "00000.000000", 0, 0.0001, color(na), color(na))
    cell(101, 3, "00000.000000", 0, 0.0001, color(na), color(na))

    cell(0,   1, volForm(upVol), 0, 0, upXCC, chart.fg_color)
    cell(101, 1, volForm(dnVol), 0, 0, dnXCC, chart.fg_color)

    cell(  0, 0, "UP",   0, 0,  color(na), chart.fg_color)
    cell(101, 0, "DOWN", 0, 0,  color(na), chart.fg_color)


    // Volume Dynamic Scale Bar
    upStng = math.round(upVol/smVol * 100)
    dnStng = 100 - upStng

    var upCol = sColor(upXCC)
    var dnCol = sColor(dnXCC)
    for i = 0 to 99
        cell(1 + i, 0, "", 0.3, 0, color(na), color(na))
        cell(1 + i, 2, "", 0.3, 0, color(na), color(na))
        cell(1 + i, 3, "", 0.3, 0.0001, color(na), color(na))
        if i < upStng
            cell(1   + i, 1, "", 0.3, 0, upCol.get(i), chart.fg_color)

        if i < dnStng
            cell(100 - i, 1, "", 0.3, 0, dnCol.get(i), chart.fg_color)


    // Average Speed
    [avgSp, minSp, maxSp, timSp] = speed(smVol, span)
    table.merge_cells(tbl, 1, 0, 100, 0)
    tbl.cell(1, 0, "AVG Speed " + avgSp, 0, 0, chart.fg_color, text_size = locNsze(tableSiz),
     tooltip = "MIN  Speed " + minSp + "\nMAX Speed " + maxSp + "\n\n\nsince " + timSp)


    // Bottom Info
    table.merge_cells(tbl, 1, 2, 100, 2)
    cell(1, 2, "Period = "  + str.tostring(nRow-2) + " @ " + tfTxt(timfram), 0, 0, color(na), chart.fg_color)


    // Flash
    if cFlsh
        varip spkTim = 0.0
        varip spkDic = 0.0
        varip spkVol = 0.0
        lstVol = mtx.get(0, 3)
        if lstVol >= avVol * vFlsh
            dir    = mtx.get(0, 1)
            spkTim := timenow + 3000
            spkDic := dir
            spkVol := lstVol

        if mtx.col(3).indexof(spkVol) != -1
            if spkDic > 0
                cell(0,   2, "+" + volForm(spkVol), 0, 0, color(na), chart.fg_color)
            if spkDic < 0
                cell(101, 2, "+" + volForm(spkVol), 0, 0, color(na), chart.fg_color)

        if spkTim > timenow + 2000
            tbl.set_bgcolor(spkDic > 0 ? color.new(upXCC, 25) : color.new(dnXCC, 25))
        else if spkTim > timenow + 1000
            tbl.set_bgcolor(spkDic > 0 ? color.new(upXCC, 50) : color.new(dnXCC, 50))
        else if spkTim > timenow
            tbl.set_bgcolor(spkDic > 0 ? color.new(upXCC, 75) : color.new(dnXCC, 75))
        else
            tbl.set_bgcolor(color(na))
https://www.tradingview.com/script/ZMdZlGaJ-Volume-Dynamic-Scale-Bar-By-MUQWISHI/