

เทคนิคของ Indicator
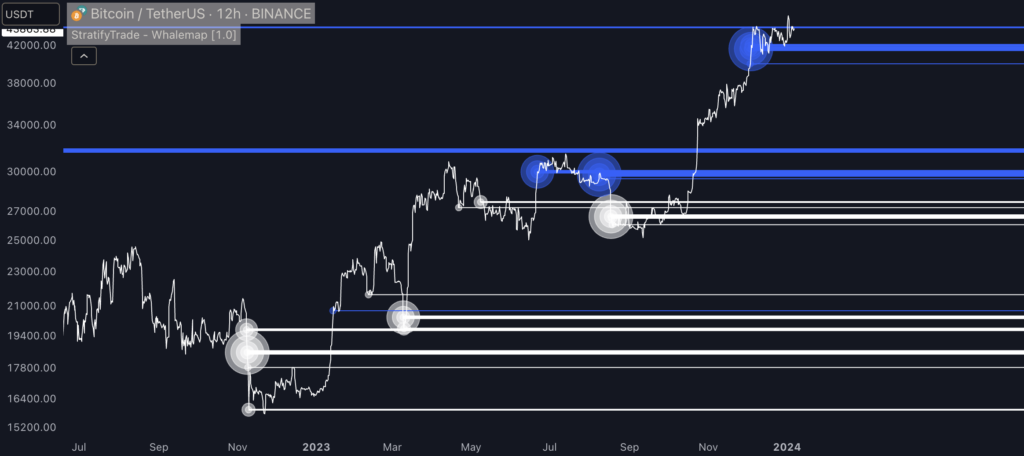
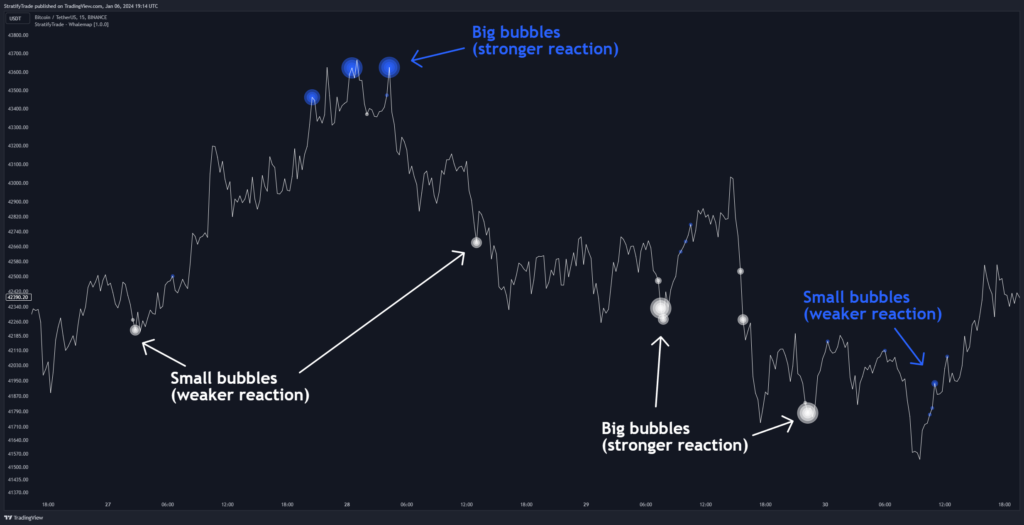
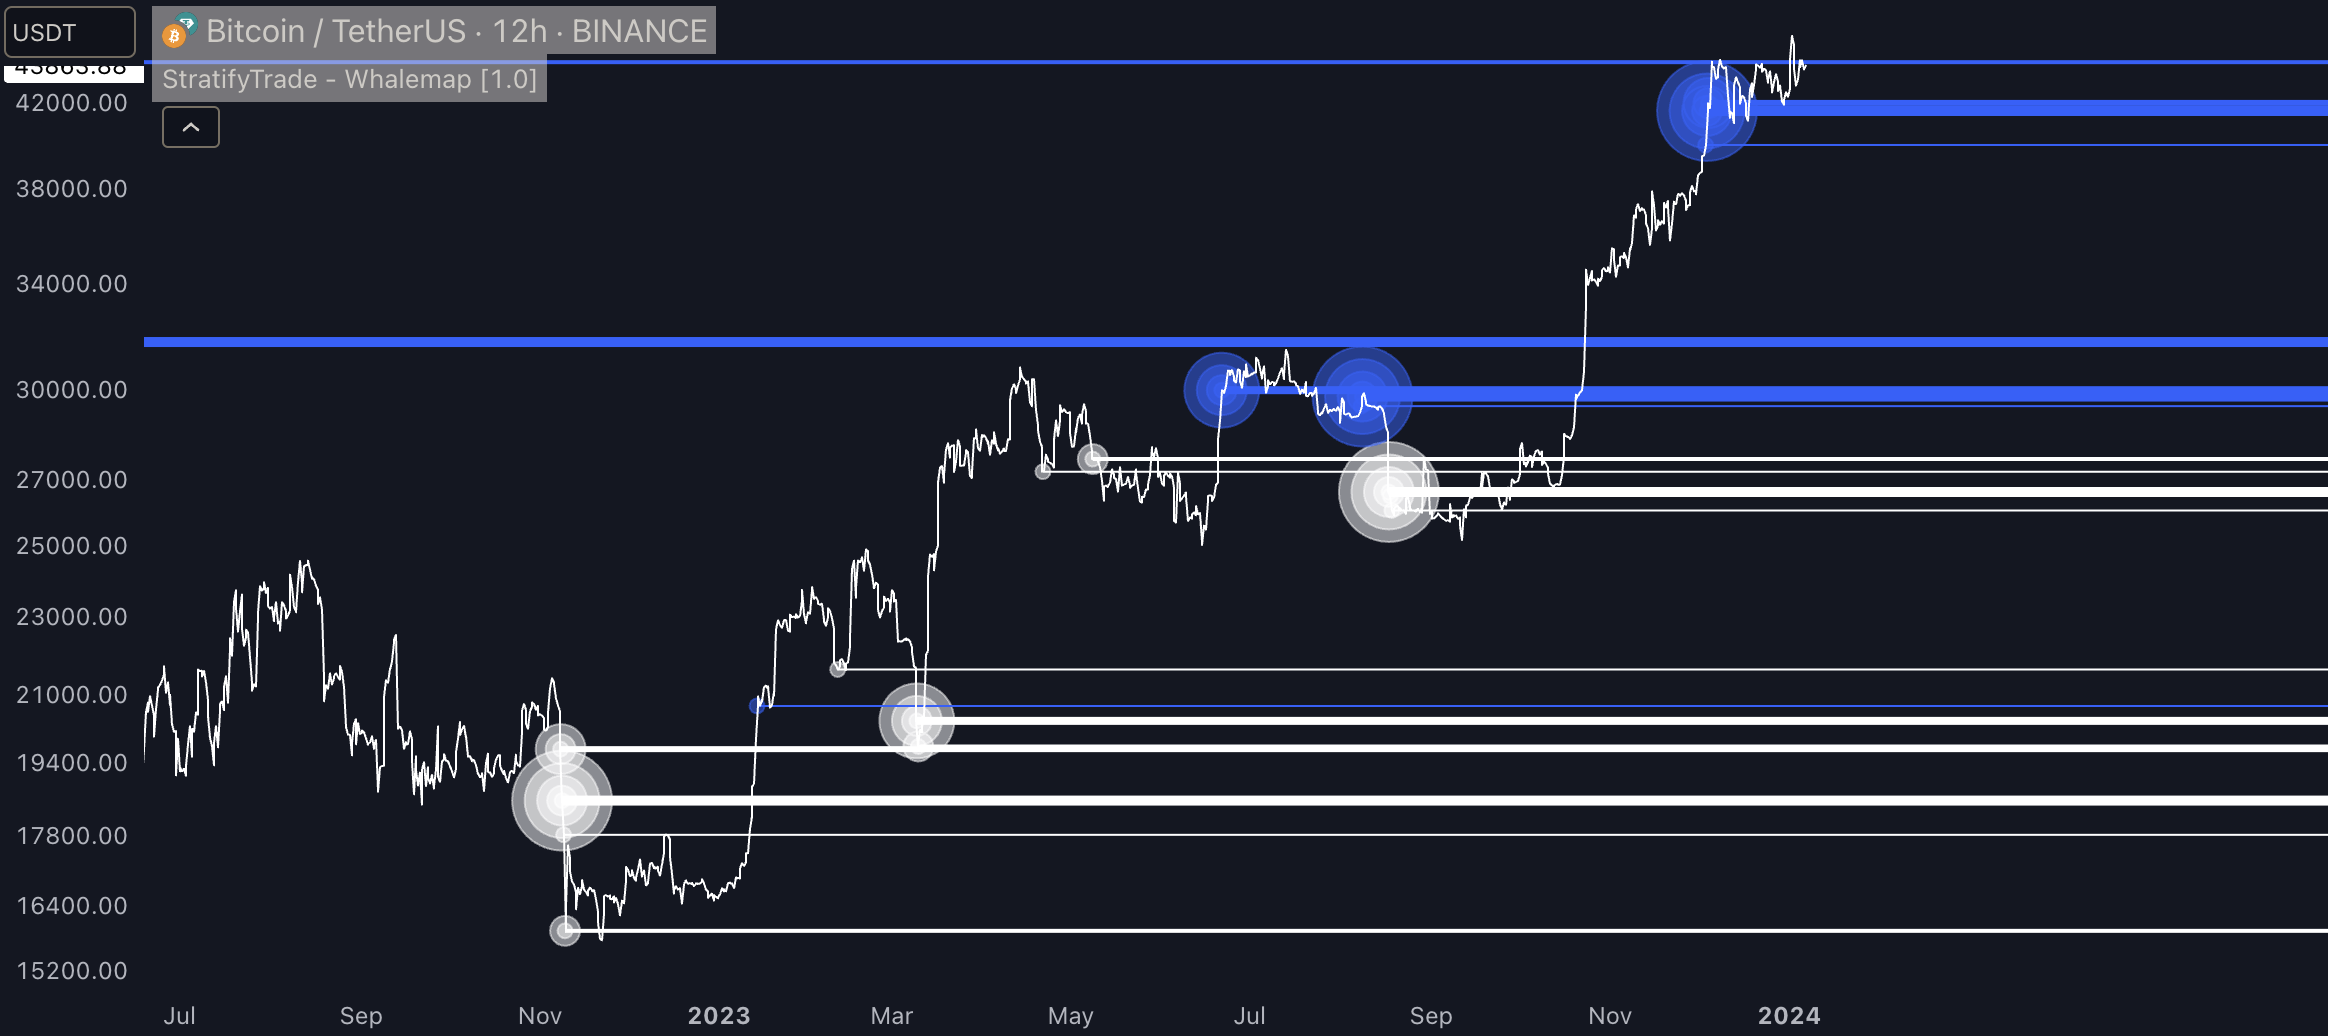
- แสดงlotการซื้อขายขนาดใหญ่ (“Whale activity”) บนแผนภูมิด้วยวงกลม.
- ขนาดของวงกลมแสดงถึงขนาดของการซื้อขาย; วงกลมใหญ่ = มีการซื้อlotใหญ่.
- บนแต่ละวงกลมมีเส้นที่แสดงขนาดของlotนั้นๆ.
- ใช้งานในโปรแกรม TradingView https://www.tradingview.com/?aff_id=134641
- เปิดบัญชีทดลอง: การเริ่มต้นของ Passive Income https://bit.ly/3Sdkir2
// This Pine Script™ code is subject to the terms of the Mozilla Public License 2.0 at https://mozilla.org/MPL/2.0/
// © StratifyTrade

//@version=5
indicator("Whalemap [StratifyTrade]", "StratifyTrade - Whalemap [1.0]", overlay = true, max_lines_count = 500)


len = input.int   (7            , "Threshold             ", group = "SETTINGS", tooltip = "Adjust Buying / Selling Activity",  minval = 2)

shBl = input.int  (1            , "Buyers Activity       ", group = "SETTINGS", inline = "a")
shBr = input.int  (1            , "Sellers Activity      ", group = "SETTINGS", inline = "b")

bull = input.color(color.white, "                      ", group = "SETTINGS", inline = "a")
bear = input.color(color.blue , "                      ", group = "SETTINGS", inline = "b")

dpBL = input.bool (true         , "                      ", group = "SETTINGS", inline = "a")
dpBR = input.bool (true         , "                      ", group = "SETTINGS", inline = "b")

dpL  = input.bool (true         , "Display Lines         ", group = "DISPLAY")
dpB  = input.bool (true         , "Display Bubbles       ", group = "DISPLAY")

dpH  = input.bool (true         , "Display Huge Bubbles  ", group = "GROUP  ")
dpG  = input.bool (true         , "Display Large Bubbles ", group = "GROUP  ")
dpN  = input.bool (true         , "Display Normal Bubbles", group = "GROUP  ")
dpS  = input.bool (true         , "Display Small Bubbles ", group = "GROUP  ")
dpT  = input.bool (true         , "Display Tiny Bubbles  ", group = "GROUP  ")

type bar
    float o = open
    float h = high
    float l = low
    float c = close
    float v = volume
    int   t = time

type maps
    float vol
    float pos
    int   loc
    int   spc

var maps[] blM = array.new<maps>(1, maps.new(0, na, na))
var maps[] brM = array.new<maps>(1, maps.new(0, na, na))

bar b = bar.new()

sma = ta.sma(volume, len)
f1  = volume > sma * 2.00
f2  = volume > sma * 1.75
f3  = volume > sma * 1.50
f4  = volume > sma * 1.25
f5  = volume > sma * 1.00

blV = blM.get(0)
brV = brM.get(0)

blV.vol := dpBL ? 0 : 1
brV.vol := dpBR ? 0 : 1

if barstate.isconfirmed


    for i = 0 to len - 1
        blV.vol += (b.c[i] > b.c[i + 1] ? b.v[i] : 0)
        brV.vol += (b.c[i] < b.c[i + 1] ? b.v[i] : 0)

    switch
        blV.vol == 0 and f1 and dpH => blM.unshift(maps.new(0, b.c, b.t, 5))
        blV.vol == 0 and f2 and dpG => blM.unshift(maps.new(0, b.c, b.t, 4))
        blV.vol == 0 and f3 and dpN => blM.unshift(maps.new(0, b.c, b.t, 3))
        blV.vol == 0 and f4 and dpS => blM.unshift(maps.new(0, b.c, b.t, 2))
        blV.vol == 0 and f5 and dpT => blM.unshift(maps.new(0, b.c, b.t, 1))

    switch
        brV.vol == 0 and f1 and dpH => brM.unshift(maps.new(0, b.c, b.t, 5))
        brV.vol == 0 and f2 and dpG => brM.unshift(maps.new(0, b.c, b.t, 4))
        brV.vol == 0 and f3 and dpN => brM.unshift(maps.new(0, b.c, b.t, 3))
        brV.vol == 0 and f4 and dpS => brM.unshift(maps.new(0, b.c, b.t, 2))
        brV.vol == 0 and f5 and dpT => brM.unshift(maps.new(0, b.c, b.t, 1))


if barstate.islast

    for ln in line.all
        ln.delete()

    if shBl > 0 and blM.size() > 0 and dpL
        for i = 0 to math.min(shBl - 1, blM.size() - 1)
            ln = blM.get(i)

            line.new(
                   x1     = ln.loc
                 , x2     = b.t + 1
                 , y1     = ln.pos
                 , y2     = ln.pos
                 , xloc   = xloc.bar_time
                 , extend = extend.right
                 , color  = bull
                 , width  = ln.spc
                 )

    if shBr > 0 and brM.size() > 0 and dpL
        for i = 0 to math.min(shBr - 1, brM.size() - 1)
            ln = brM.get(i)

            line.new(
                   x1     = ln.loc
                 , x2     = b.t + 1
                 , y1     = ln.pos
                 , y2     = ln.pos
                 , xloc   = xloc.bar_time
                 , extend = extend.right
                 , color  = bear
                 , width  = ln.spc
                 )


plotshape(blV.vol == 0 and f1 and dpB and dpH ? close : na, style = shape.circle, location = location.absolute, size = size.huge  , color = color.new(bull, 50))
plotshape(blV.vol == 0 and f2 and dpB and dpG ? close : na, style = shape.circle, location = location.absolute, size = size.large , color = color.new(bull, 50))
plotshape(blV.vol == 0 and f3 and dpB and dpN ? close : na, style = shape.circle, location = location.absolute, size = size.normal, color = color.new(bull, 50))
plotshape(blV.vol == 0 and f4 and dpB and dpS ? close : na, style = shape.circle, location = location.absolute, size = size.small , color = color.new(bull, 50))
plotshape(blV.vol == 0 and f5 and dpB and dpT ? close : na, style = shape.circle, location = location.absolute, size = size.tiny  , color = color.new(bull, 50))

plotshape(brV.vol == 0 and f1 and dpB and dpH ? close : na, style = shape.circle, location = location.absolute, size = size.huge  , color = color.new(bear, 50))
plotshape(brV.vol == 0 and f2 and dpB and dpG ? close : na, style = shape.circle, location = location.absolute, size = size.large , color = color.new(bear, 50))
plotshape(brV.vol == 0 and f3 and dpB and dpN ? close : na, style = shape.circle, location = location.absolute, size = size.normal, color = color.new(bear, 50))
plotshape(brV.vol == 0 and f4 and dpB and dpS ? close : na, style = shape.circle, location = location.absolute, size = size.small , color = color.new(bear, 50))
plotshape(brV.vol == 0 and f5 and dpB and dpT ? close : na, style = shape.circle, location = location.absolute, size = size.tiny  , color = color.new(bear, 50))
https://www.tradingview.com/script/8gQVo6Xn-Whalemap-StratifyTrade/
