
- เทคนิคของ Indicator:
- รองรับหลาย Time-Frame ด้วยฟังก์ชัน Zigzag ขั้นสูง.
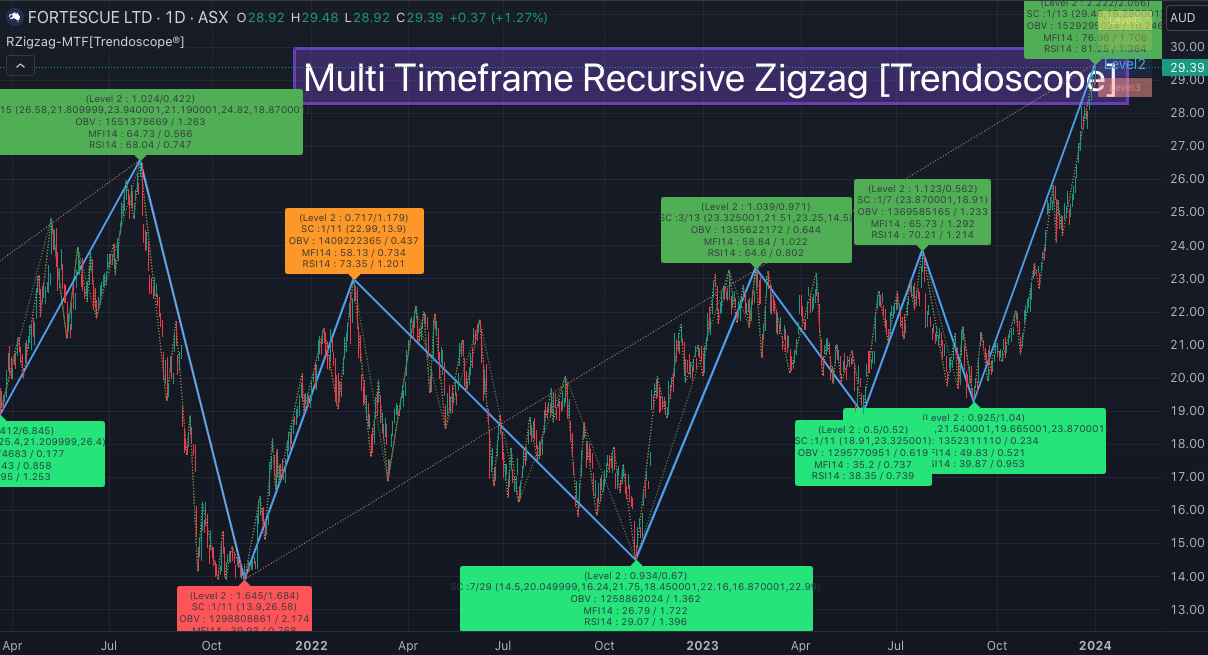
- ใช้ Recursive Zigzag Algorithm สำหรับการวิเคราะห์ที่ละเอียดยิ่งขึ้น.
- มีการวิเคราะห์ Sub-Waves และ Micro-Waves.
- ติดตามและบันทึกค่าจาก Indicators หรือ Oscillators ที่กำหนด.
- การแสดงผล Zigzag แบบโค้งสำหรับการมองเห็นที่ชัดเจนขึ้น.
- มีการแจ้งเตือนที่สามารถปรับแต่งได้.
- บอกสัญญาณซื้อและขาย:
- ไม่ได้ระบุชัดเจนเกี่ยวกับสัญญาณซื้อหรือขายโดยตรง.
- มุ่งเน้นการใช้ในการรู้จำและวิเคราะห์รูปแบบต่างๆ มากกว่าการระบุจุดสูงสุดหรือต่ำสุดของตลาด.
- ใช้งานในโปรแกรม TradingView https://www.tradingview.com/?aff_id=134641
- เปิดบัญชีทดลอง: การเริ่มต้นของ Passive Income https://bit.ly/3Sdkir2
// This work is licensed under Creative Commons Attribution-NonCommercial-ShareAlike 4.0 International License (CC BY-NC-SA 4.0) https://creativecommons.org/licenses/by-nc-sa/4.0/
// © Trendoscope Pty Ltd
//                                       ░▒
//                                  ▒▒▒   ▒▒
//                              ▒▒▒▒▒     ▒▒
//                      ▒▒▒▒▒▒▒░     ▒     ▒▒
//                  ▒▒▒▒▒▒           ▒     ▒▒
//             ▓▒▒▒       ▒        ▒▒▒▒▒▒▒▒▒▒▒
//   ▒▒▒▒▒▒▒▒▒▒▒ ▒        ▒▒▒▒▒▒▒▒▒▒▒▒▒▒▒▒▒▒▒▒
//   ▒  ▒       ░▒▒▒▒▒▒▒▒▒▒▒▒▒▒▒▒▒▒▒▒▒▒▒▒▒▒▒▒▒░
//   ▒▒▒▒▒▒▒▒▒▒▒▒▒▒▒▒▒▒▒▒▒▒▒▒▒▒▒▒▒▒▒▒░▒▒▒▒▒▒▒▒
//   ▓▒▒▒▒▒▒▒▒▒▒▒▒▒▒▒▒▒▒▒▒ ▒▒
//    ▒▒▒▒▒         ▒▒▒▒▒▒▒
//                 ▒▒▒▒▒▒▒▒▒
//                ▒▒▒▒▒ ▒▒▒▒▒
//               ░▒▒▒▒   ▒▒▒▒▓      ████████╗██████╗ ███████╗███╗   ██╗██████╗  ██████╗ ███████╗ ██████╗ ██████╗ ██████╗ ███████╗
//              ▓▒▒▒▒     ▒▒▒▒      ╚══██╔══╝██╔══██╗██╔════╝████╗  ██║██╔══██╗██╔═══██╗██╔════╝██╔════╝██╔═══██╗██╔══██╗██╔════╝
//              ▒▒▒▒▒▒▒▒▒▒▒▒▒▒▒        ██║   ██████╔╝█████╗  ██╔██╗ ██║██║  ██║██║   ██║███████╗██║     ██║   ██║██████╔╝█████╗
//             ▒▒▒▒▒       ▒▒▒▒▒       ██║   ██╔══██╗██╔══╝  ██║╚██╗██║██║  ██║██║   ██║╚════██║██║     ██║   ██║██╔═══╝ ██╔══╝
//            ▒▒▒▒▒         ▒▒▒▒▒      ██║   ██║  ██║███████╗██║ ╚████║██████╔╝╚██████╔╝███████║╚██████╗╚██████╔╝██║     ███████╗
//             ▒▒             ▒
//@version=5
import Trendoscope/Zigzag/6 as zg
import HeWhoMustNotBeNamed/utils/1 as ut
import HeWhoMustNotBeNamed/RecursiveAlerts/2 as ra

indicator("Multi-Timeframe Recursive Zigzag [Trendoscope®]", "RZigzag-MTF[Trendoscope®]", overlay = true, max_lines_count=500, max_labels_count=500, max_bars_back = 1000)
theme = input.string('Dark', title='Theme', options=['Light', 'Dark'], group='Generic Settings',
         tooltip='Chart theme settings. Line and label colors are generted based on the theme settings. If dark theme is selected, '+
         'lighter colors are used and if light theme is selected, darker colors are used.', display=display.none)

timeframe = input.timeframe("", "Timeframe", group="Zigzag", tooltip = 'Timeframe on which the zigzag needs to be calculated', display = display.none)
zigzagLength = input.int(5, step=5, minval=1, title='Length', group='Zigzag', tooltip='Zigzag length for level 0 zigzag', display=display.none)
depth = input.int(200, "Depth", step=25, maxval=500, group='Zigzag', tooltip='Zigzag depth refers to max number of pivots to show on chart for level 0 zigzag.'+
                             ' This number will also impact the recursive calculation and number of levels of zigzag displayed on the chart.', display=display.none)
highlight = input.int(1, "Highlight Level", group='Zigzag', minval = 0, tooltip = 'Highlight one level of the zigzag out of the available', display=display.none)
useRealTimeBars = input.bool(true, 'Use Real Time Bars', group='Zigzag', tooltip = 'If enabled real time bars are used for calculation. Otherwise, only confirmed bars are used', display=display.none)
curvedZigzag = input.bool(false, 'Curved Zigzag', group='Zigzag', tooltip = 'If enabled, prints curved zigzag instead of straight lines', display=display.none)
enableRsi = input.bool(true, 'RSI', group='Indicators', inline='rsi', display=display.none)
rsiLength = input.int(14, '', group='Indicators', inline='rsi', tooltip='Enable and configure RSI indicator', display=display.none)

enableMfi = input.bool(true, 'MFI', group='Indicators', inline='mfi', display=display.none)
mfiLength = input.int(14, '', group='Indicators', inline='mfi', tooltip='Enable and configure MFI indicator', display=display.none)

enableObv = input.bool(true, 'OBV', group='Indicators', inline='obv', tooltip = 'Enable and configure OBV indicator', display=display.none)

enableCustom = input.bool(false, '', group='Custom External Indicator', inline='custom', display=display.none)
customName = input.string('Custom', '', group='Custom External Indicator', inline='custom', display=display.none)
customValue = input.source(close, '', group='Custom External Indicator', inline='custom', tooltip = 'Enable and configure custom external indicator', display=display.none)
showLabel = false

alertTooltip = 'Confirmed Pivot refers to last but one pivot which is confirmed. Alerting on confirmed pivot means alerts are triggered only when a new confirmed pivot is formed. '+
                 'This also means there will be lag in the alert. On the contry, if you select Last Pivot Update alerts will be on real time. But, remember that last pivot of the Zigzag always repaint. Hence, there will be lots of alerts and repaints'
alertType = input.string('Confirmed Pivot Update', 'Alert Type', ['Confirmed Pivot Update', 'Last Pivot Update'], tooltip = alertTooltip, group='Alert', display=display.none)

alertPivot = alertType == 'Confirmed Pivot Update'? 1 : 0
defaultAlertTemplate = '{
                 \n\t"type" : "{alertType}",
                 \n\t"level": "{level}",
                 \n\t"pivot" : {pivot}
             \n}'
alertTemplate = input.text_area (defaultAlertTemplate, '', group='Alert', display=display.none)
offset = useRealTimeBars? 0 : 1

showLabel := enableRsi or enableMfi or enableObv or (enableCustom and customValue!=close)

themeColors = ut.getColors(theme)

getZigzag()=>
    indicators = matrix.new<float>()
    indicatorNames = array.new<string>()
    if(enableRsi)
        indicatorNames.unshift('RSI'+str.tostring(rsiLength))
        indicators.add_row(0, array.from(ta.rsi(high, rsiLength), ta.rsi(low, rsiLength), ta.rsi(close, rsiLength)))

    if(enableMfi)
        indicatorNames.unshift('MFI'+str.tostring(mfiLength))
        indicators.add_row(0, array.from(ta.mfi(high, mfiLength), ta.mfi(low, mfiLength), ta.mfi(close, mfiLength)))

    if(enableObv)
        indicatorNames.unshift('OBV')
        indicators.add_row(0, array.from(ta.obv, ta.obv, ta.obv))

    if(enableCustom and (customValue!=close or na(customValue)))
        indicatorNames.unshift(customName)
        indicators.add_row(0, array.from(customValue, customValue, customValue))

    var zg.Zigzag zigzag = zg.Zigzag.new(zigzagLength, depth, offset)
    [lh, ll, lt] = request.security_lower_tf("", "", [high, low, time])
    lowTime = time
    highTime = time
    if(lt.size() > 0)
        highestIndex = lh.sort_indices(order.descending).get(0)
        lowestIndex = ll.sort_indices(order.ascending).get(0)
        lowTime := lt.get(lowestIndex)
        highTime := lt.get(highestIndex)

    zigzag.calculate(array.from(high, low), indicators, indicatorNames, highTime, lowTime)
    if(zigzag.zigzagPivots.size() < 0)
        zigzag.zigzagPivots := zigzag.zigzagPivots.slice(0, zigzag.zigzagPivots.size())
    barstate.islast? zigzag : na

indicatorTf = timeframe.in_seconds("") > timeframe.in_seconds(timeframe) ? "" : timeframe
zigzag = request.security("", indicatorTf, getZigzag())

if(barstate.islast)
    var array<zg.ZigzagDrawingPL> drawingArray = array.new<zg.ZigzagDrawingPL>()
    var firstDraw = true
    var lastPivotBar = 0
    if((firstDraw or zigzag.flags.newPivot))
        drawingArray.clear()
        firstDraw := false

        mlzigzag = zigzag
        varip print = true

        rowNum = 0
        var legend = table.new(position=position.top_right, columns=2, rows=100, border_width=1)
        table.clear(legend, 0, 0, 1, 99)
        while(mlzigzag.zigzagPivots.size() > 3)
            labelColor = themeColors.remove(0)
            themeColors.push(labelColor)
            highlightLevel = rowNum == highlight
            lineWidth = highlightLevel ? 2 : 0
            lineStyle = highlightLevel ? line.style_solid:line.style_dotted
            lineColor = highlightLevel ? labelColor : color.new(labelColor, 30)
            zg.ZigzagProperties props = zg.ZigzagProperties.new(lineColor, lineWidth, lineStyle, highlightLevel, maxObjects = depth, curved=curvedZigzag)
            zg.ZigzagDrawingPL drawing = zg.ZigzagDrawingPL.new(mlzigzag, props)
            drawing.drawplain()
            drawingArray.push(drawing)
            if(highlightLevel)
                alertPivotPoint = mlzigzag.zigzagPivots.get(alertPivot)
                if(lastPivotBar < alertPivotPoint.point.index)
                    lastPivotBar := alertPivotPoint.point.index
                    keys = array.from('{alertType}', '{level}', '{pivot}')
                    values = array.from(alertType, str.tostring(highlight), alertPivotPoint.tostring())
                    currentAlert = ra.updateAlertTemplate(alertTemplate, keys, values)
                    alert(currentAlert, alert.freq_once_per_bar_close)
            table.cell(legend, 0, rowNum, 'Level'+str.tostring(rowNum), text_color=lineColor,
                             bgcolor=color.new(labelColor, highlightLevel? 90 : 50),
                             text_size = highlightLevel?size.normal : size.small)
            mlzigzag := mlzigzag.nextlevel()
            rowNum+=1
https://www.tradingview.com/script/3rKS4EMJ-Multi-Timeframe-Recursive-Zigzag-Trendoscope/