
ในยุคดิจิทัลที่ AI กำลังเปลี่ยนโฉมหน้าวงการธุรกิจ การใช้เครื่องมืออย่าง ChatGPT อย่างชาญฉลาดสามารถเป็นกุญแจสำคัญสู่ความสำเร็จ บทความนี้จะแนะนำ 30 Prompts ทรงพลังที่จะช่วยคุณในการวิเคราะห์ตลาด กำหนดกลยุทธ์ และสร้างแผนปฏิบัติการทางธุรกิจได้อย่างมีประสิทธิภาพ
ทำไมต้องใช้ ChatGPT ในการวิเคราะห์ธุรกิจ?
ChatGPT เป็นเครื่องมือ AI ที่สามารถประมวลผลข้อมูลจำนวนมากและให้ข้อมูลเชิงลึกที่มีคุณค่าได้อย่างรวดเร็ว การใช้ Prompts ที่เหมาะสมจะช่วยให้คุณได้รับข้อมูลที่เฉพาะเจาะจงและนำไปใช้ประโยชน์ได้จริง
ท่านสามารถเลือกใช้งานAIจากค่ายไหนก็ได้ครับ
| คุณสมบัติ | ChatGPT | Microsoft Copilot | Claude | Gemini | Perplexity |
|---|---|---|---|---|---|
| ผู้พัฒนา | OpenAI | Microsoft | Anthropic | Perplexity AI | |
| โมเดลพื้นฐาน | GPT-3.5/GPT-4 | GPT-4 | Claude | PaLM 2/Gemini | GPT-3.5/GPT-4 |
| การรองรับภาษา | หลายภาษา | หลายภาษา | หลายภาษา | หลายภาษา | หลายภาษา |
| ความสามารถในการประมวลผลภาพ | มี (GPT-4) | มี | มี | มี | มี |
| การเข้าถึงข้อมูลเรียลไทม์ | ไม่มี | มี | ไม่มี | มี | มี |
| ความสามารถในการเขียนโค้ด | ดี | ดีมาก | ดีมาก | ดี | ดี |
| การใช้งานฟรี | มีแบบจำกัด | มี | มีแบบจำกัด | มี | มี |
| แพลตฟอร์มที่รองรับ | เว็บ, มือถือ | Windows, Edge | เว็บ, API | เว็บ, มือถือ, API | เว็บ, มือถือ |
| ความสามารถในการสร้างเนื้อหา | ดีมาก | ดีมาก | ดีมาก | ดีมาก | ดี |
| การอ้างอิงแหล่งข้อมูล | ไม่มี | มี | ไม่มี | มี | มี |
ใช้งานChatGPT https://chatgpt.com/
ใช้งาน microsoft Copilot https://copilot.microsoft.com/
ใช้งาน Gemini https://gemini.google.com/app
ใช้งาน perplexity https://www.perplexity.ai/
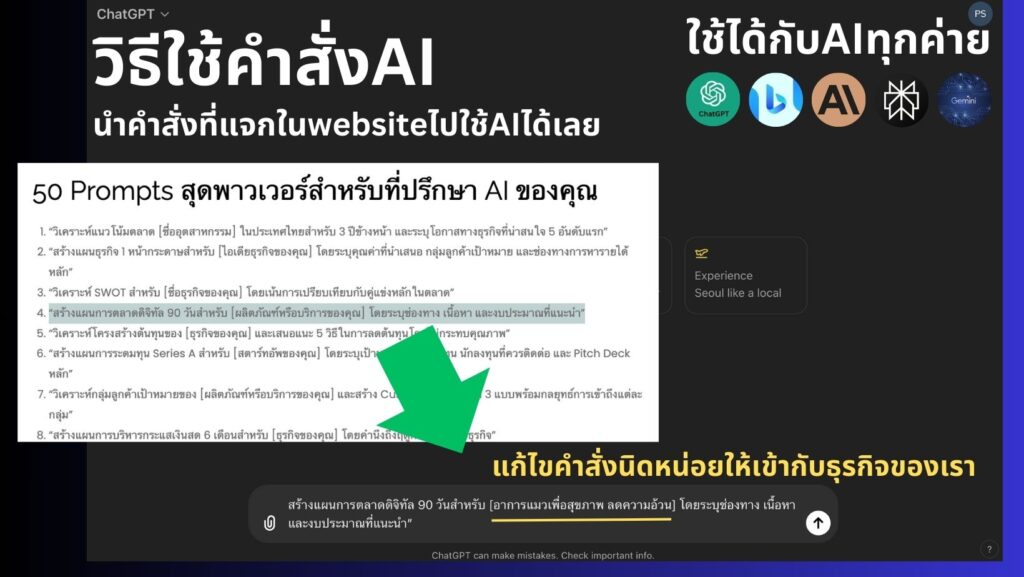

30 Prompts เด็ดสำหรับการวิเคราะห์และวางแผนธุรกิจ
- “วิเคราะห์แนวโน้มตลาด [ชื่ออุตสาหกรรม] ในประเทศไทยสำหรับ 5 ปีข้างหน้า ระบุโอกาสและความท้าทายหลัก”
- “สร้าง SWOT Analysis สำหรับ [ชื่อบริษัทหรือผลิตภัณฑ์] โดยเปรียบเทียบกับคู่แข่งหลัก 3 ราย”
- “วิเคราะห์ส่วนแบ่งตลาดของ [ผลิตภัณฑ์หรือบริการ] ในประเทศไทย ระบุผู้นำตลาดและโอกาสสำหรับผู้เล่นรายใหม่”
- “สร้างแผนกลยุทธ์การตลาดดิจิทัล 12 เดือนสำหรับ [ชื่อแบรนด์] รวมถึงช่องทาง เนื้อหา และงบประมาณที่แนะนำ”
- “วิเคราะห์พฤติกรรมผู้บริโภคในกลุ่ม [ระบุกลุ่มเป้าหมาย] และเสนอแนะ 5 กลยุทธ์การตลาดที่มีประสิทธิภาพ”
- “สร้าง Customer Persona 3 แบบสำหรับ [ผลิตภัณฑ์หรือบริการ] พร้อมระบุความต้องการ ความชอบ และพฤติกรรมการซื้อ”
- “วิเคราะห์ห่วงโซ่อุปทานของอุตสาหกรรม [ชื่ออุตสาหกรรม] และเสนอแนะ 3 วิธีในการเพิ่มประสิทธิภาพ”
- “สร้างแผนการเปิดตัวผลิตภัณฑ์ใหม่ [ชื่อผลิตภัณฑ์] รวมถึงกิจกรรมการตลาด การประชาสัมพันธ์ และการกระจายสินค้า”
- “วิเคราะห์ประสิทธิภาพของช่องทางการจัดจำหน่ายปัจจุบันของ [ชื่อบริษัท] และเสนอแนะช่องทางใหม่ที่มีศักยภาพ”
- “สร้างแผนการบริหารความเสี่ยงสำหรับ [โครงการหรือกลยุทธ์ทางธุรกิจ] โดยระบุความเสี่ยงหลัก 5 ประการและกลยุทธ์การรับมือ”
- “วิเคราะห์กลยุทธ์การตั้งราคาของคู่แข่งหลักในตลาด [ชื่อผลิตภัณฑ์หรือบริการ] และเสนอแนะกลยุทธ์การตั้งราคาที่เหมาะสมสำหรับเรา”
- “สร้างแผนการขยายธุรกิจไปยังตลาดต่างประเทศสำหรับ [ชื่อบริษัท] โดยระบุตลาดเป้าหมาย 3 อันดับแรกและกลยุทธ์การเข้าสู่ตลาด”
- “วิเคราะห์ประสิทธิภาพของแคมเปญการตลาดล่าสุดของ [ชื่อแบรนด์] และเสนอแนะ 3 ไอเดียสำหรับแคมเปญถัดไป”
- “สร้างแผนการพัฒนาผลิตภัณฑ์ใหม่สำหรับ [ชื่อบริษัท] โดยระบุช่องว่างในตลาดและแนวคิดผลิตภัณฑ์ที่มีศักยภาพ 3 อย่าง”
- “วิเคราะห์ทิศทางเทคโนโลยีในอุตสาหกรรม [ชื่ออุตสาหกรรม] และเสนอแนะวิธีการนำเทคโนโลยีมาใช้เพื่อสร้างความได้เปรียบทางการแข่งขัน”
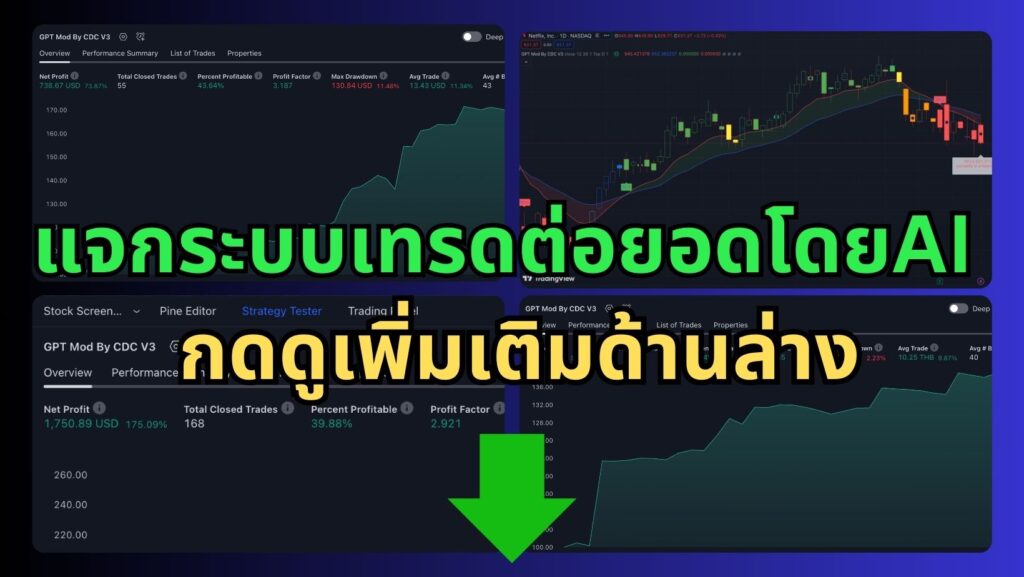
ผมได้ไปเจอคลิปนี้ มีการแจกระบบเทรดของลุงโฉลก ซึ่งเป็น CDC ActionZone ก็เลยเอาไปปรับแต่งเพิ่มนิดๆหน่อยๆ ให้ทำการเปิดสัญญาณซื้อขาย กับเพิ่มสัญลักษณ์การใช้งานให้ง่ายขึ้น

1.เปิดบัญชีทดลอง
ทดลองเทรด Binaryoption (เหมาะก็ต่อเมื่อเปิดดูสัญญาณ TF 1H ขึ้นไป) ฝึกฝนเทรดฟรีคลิกที่นี่
ทดลองเทรดForex (ใช้ได้ดีกับสัญญาณนี้) ฝึกฝนเทรดฟรีคลิกที่นี่
2.ไปที่ https://www.tradingview.com/ แล้วเอาCodeที่ผมแจก ก็อปวางได้เลยครับ
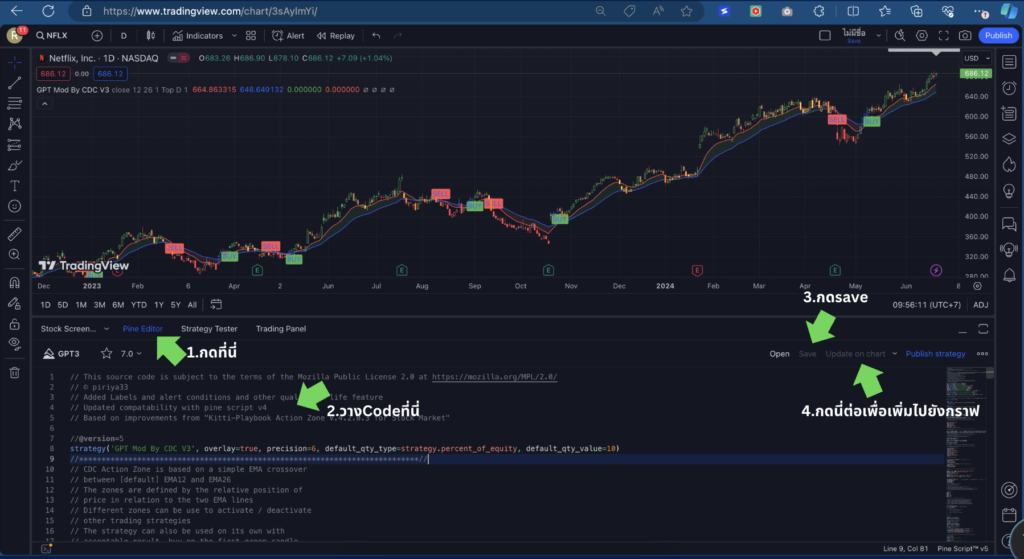
// This source code is subject to the terms of the Mozilla Public License 2.0 at https://mozilla.org/MPL/2.0/
// © piriya33
// Added Labels and alert conditions and other quality of life feature
// Updated compatability with pine script v4
// Based on improvements from "Kitti-Playbook Action Zone V.4.2.0.3 for Stock Market"

//@version=5
strategy('GPT Mod By CDC V3', overlay=true, precision=6, default_qty_type=strategy.percent_of_equity, default_qty_value=10)
//****************************************************************************//
// CDC Action Zone is based on a simple EMA crossover
// between [default] EMA12 and EMA26
// The zones are defined by the relative position of
// price in relation to the two EMA lines
// Different zones can be use to activate / deactivate
// other trading strategies
// The strategy can also be used on its own with
// acceptable result, buy on the first green candle
// and sell on the first red candle
//****************************************************************************//
//****************************************************************************//
// Define User Input Variables

xsrc = input.source(title='Source Data', defval=close)
xprd1 = input.int(title='Fast EMA period', defval=12)
xprd2 = input.int(title='Slow EMA period', defval=26)
xsmooth = input.int(title='Smoothing period (1 = no smoothing)', defval=1)
fillSW = input.bool(title='Paint Bar Colors', defval=true)
fastSW = input.bool(title='Show fast moving average line', defval=true)
slowSW = input.bool(title='Show slow moving average line', defval=true)
labelSwitch = input.bool(title='Turn on assistive text', defval=true)
plotSigsw = input.bool(title='Plot Buy/Sell Signals? ', defval=true)
plotRibsw = input.bool(title='Plot Buy/Sell Ribbon', defval=false)
plotRibbonPos = input.string(title='Ribbon Position', options=['Top', 'Bottom'], defval='Top')

xfixtf = input.bool(title='** Use Fixed time frame Mode (advanced) **', defval=false)
xtf = input.timeframe(title='** Fix chart to which time frame ? **)', defval='D')

plotSig2sw = input.bool(title='Plot momentum based Buy/Sell Signals? ', defval=false)
plotSig2lv = input.int(title='Set signal threshold (higher = stricter)', defval=1, minval=0, maxval=1)

//****************************************************************************//
//Calculate Indicators

f_secureSecurity(_symbol, _res, _src) => request.security(_symbol, _res, _src[1], lookahead = barmerge.lookahead_on) // Using f_secureSecurity to avoid repainting

xPrice = ta.ema(xsrc, xsmooth)


FastMA = xfixtf ?
 ta.ema(f_secureSecurity(syminfo.tickerid, xtf, ta.ema(xsrc, xprd1)), xsmooth)
 :
 ta.ema(xPrice, xprd1)


SlowMA = xfixtf ?
 ta.ema(f_secureSecurity(syminfo.tickerid, xtf, ta.ema(xsrc, xprd2)), xsmooth)
 :
 ta.ema(xPrice, xprd2)

Bull = FastMA > SlowMA
Bear = FastMA < SlowMA

//****************************************************************************//
// Define Color Zones

Green = Bull and xPrice > FastMA  // Buy
Blue = Bear and xPrice > FastMA and xPrice > SlowMA  //Pre Buy 2
LBlue = Bear and xPrice > FastMA and xPrice < SlowMA  //Pre Buy 1

Red = Bear and xPrice < FastMA  // Sell
Orange = Bull and xPrice < FastMA and xPrice < SlowMA  // Pre Sell 2
Yellow = Bull and xPrice < FastMA and xPrice > SlowMA  // Pre Sell 1

//****************************************************************************//
// Display color on chart


bColor = Green ? color.green :
 Blue ? color.blue :
 LBlue ? color.aqua :
 Red ? color.red :
 Orange ? color.orange :
 Yellow ? color.yellow :
 color.black
barcolor(color=fillSW ? bColor : na)

//****************************************************************************//
// Display MA lines

FastL = plot(fastSW ? FastMA : na, 'Fast EMA', color=color.new(color.red, 0), style = xfixtf ? plot.style_stepline : plot.style_line)
SlowL = plot(slowSW ? SlowMA : na, 'Slow EMA', color=color.new(color.blue, 0), style = xfixtf ? plot.style_stepline : plot.style_line)
fillcolor = Bull ? color.new(color.green,90) : Bear ? color.new(color.red,90) : color.new(color.black,90) // fillcolor = Bull ? color.green : Bear ? color.red : color.black
fill(FastL, SlowL, fillcolor) // fill(FastL, SlowL, fillcolor, transp=90)

//****************************************************************************//
// Define Buy and Sell condition
// This is only for thebasic usage of CDC Actionzone (EMA Crossover)
// ie. Buy on first green bar and sell on first red bar

buycond = Green and Green[1] == 0
sellcond = Red and Red[1] == 0

bullish = ta.barssince(buycond) < ta.barssince(sellcond)
bearish = ta.barssince(sellcond) < ta.barssince(buycond)

buy = bearish[1] and buycond
sell = bullish[1] and sellcond

bColor_BullBear = bullish ? color.green : bearish ? color.red : color.black

//****************************************************************************//
// Plot Buy and Sell point on chart

plotshape(plotSigsw ? buy : na,
 style=shape.labelup,
 title='Buy Signal',
 location=location.belowbar,
 color=color.new(color.green, 0),
 text="BUY")
plotshape(plotSigsw ? sell : na,
 style=shape.labeldown,
 title='Sell Signal',
 location=location.abovebar,
 color=color.new(color.red, 0),
 text="SELL")

// Display Buy/Sell Ribbon


plotshape(plotRibsw ? plotRibbonPos == 'Top' ? close : na : na,
 style=shape.square,
 title='Buy/Sell Ribbon',
 location=location.top,
 color=bColor_BullBear)

plotshape(plotRibsw ? plotRibbonPos == 'Bottom' ? close : na : na,
 style=shape.square,
 title='Buy/Sell Ribbon',
 location=location.bottom,
 color=bColor_BullBear)


//****************************************************************************//
// Label

labelstyle = close > SlowMA ? label.style_label_down : label.style_label_up
labelyloc = close > SlowMA ? yloc.abovebar : yloc.belowbar
labeltcolor = buy ? color.black :
 sell ? color.white :
 close > close[1] ? color.green :
 color.red
labelbgcolor = buy ? color.green : sell ? color.red : color.silver
labeltext = buy ? 'BUY next bar\n' : sell ? 'SELL next bar\n' : ' '
trendText = bullish ? 'bullish' : bearish ? 'bearish' : 'sideways'


l1 = label.new(bar_index, na,
 text=labeltext + syminfo.ticker + ' ' + str.tostring(close) + ' ' + syminfo.currency + '\n currently in a ' + trendText + ' trend \n',
 color=labelbgcolor,
 textcolor=labeltcolor,
 yloc=labelyloc,
 style=labelstyle)

label.delete(labelSwitch ? l1[1] : l1)

// Momentum Signal using StochRSI

// Adds a momentum based signal following trends to the script
// Default is hidden, only use with caution
// Parameters for STOCH RSI is hard-coded to avoid cluttering the input screen further
// If you need to change anything, make a copy of the code and change it.
// Inputs are commented out, to enable them comment out the hard coded variables first!

// fixed inputs //

smoothK = 3
smoothD = 3
RSIlen = 14
STOlen = 14
SRsrc = close
OSlevel = 30
OBlevel = 70

// User inputs // // COMMENT ABOVE VARIABLES FIRST!!

// smoothK = input(3,"StochRSI smooth K",type=input.integer,minval=1)
// smoothD = input(3,"StochRSI smooth D",type=input.integer,minval=1)
// RSIlen = input(14,"RSI length",type=input.integer,minval=1)
// STOlen = input(14,"Stochastic length",type=input.integer,minval=1)
// SRsrc = input(close,"Source for StochasticRSI",type=input.source)
// OSlevel = input(30,"Oversold Threshold",type=input.float,minval=0.00)
// OBlevel = input(70,"Oversold Threshold",type=input.float,minval=0.00)

// calculations //
rsi1 = ta.rsi(SRsrc, RSIlen)
k = ta.sma(ta.stoch(rsi1, rsi1, rsi1, STOlen), smoothK)
d = ta.sma(k, smoothD)

// storsiBuySig =  if bullish
//     if (d < OSlevel and crossover(k,d))
//         3
//     else if crossover(k,OSlevel)
//         2
//     else if d > OSlevel and crossover(k,d)
//         1
//     else
//         0
// else
//     0

crossover_1 = ta.crossover(k, d)
crossover_2 = ta.crossover(k, d)
iff_1 = d > OSlevel and crossover_2 ?
 1 : 0
iff_2 = d < OSlevel and crossover_1 ?
 2 : iff_1
storsiBuySig = bullish ? iff_2 : 0

crossunder_1 = ta.crossunder(k, d)
crossunder_2 = ta.crossunder(k, d)
iff_3 = d < OBlevel and crossunder_2 ?
 1 : 0
iff_4 = d > OBlevel and crossunder_1 ?
 2 : iff_3
storsiSellSig = bearish ? iff_4 : 0

plotshape(plotSig2sw ? storsiBuySig > plotSig2lv ? storsiBuySig : na : na,
 'Buy more signals', style=shape.triangleup,
  location=location.belowbar, color=color.new(color.teal, 0))
plotshape(plotSig2sw ? storsiSellSig > plotSig2lv ? storsiSellSig : na : na,
 'Sell more signals', style=shape.triangledown,
  location=location.abovebar, color=color.new(color.orange, 0))


//****************************************************************************//
// Alert conditions

alertcondition(buy,
 title='*Buy Alert',
 message='Buy {{exchange}}:{{ticker}}')

alertcondition(sell,
 title='*Sell Alert',
 message='Sell {{exchange}}:{{ticker}}')

alertcondition(bullish,
 title='is Bullish')

alertcondition(bearish,
 title='is Bearish')

alertcondition(Green,
 title='is Green')

alertcondition(Blue,
 title='is Blue (Strong Rally)')

alertcondition(LBlue,
 title='is Light Blue (Rally)')

alertcondition(Red,
 title='is Red')

alertcondition(Orange,
 title='is Orange (Strong Dip)')

alertcondition(Yellow,
 title='is Yellow (Dip)')


//****************************************************************************//

// Entry and Exit Strategy
if (buy)
    strategy.entry("Buy", strategy.long)

if (sell)
strategy.close("Buy")- “สร้างแผนการปรับปรุงประสบการณ์ลูกค้าสำหรับ [ชื่อบริษัทหรือบริการ] โดยระบุ 5 จุดสัมผัสหลักและวิธีการปรับปรุง”
- “วิเคราะห์ประสิทธิภาพของช่องทางการสื่อสารการตลาดปัจจุบันของ [ชื่อแบรนด์] และเสนอแนะการจัดสรรงบประมาณที่เหมาะสมสำหรับแต่ละช่องทาง”
- “สร้างแผนการสร้างความภักดีต่อแบรนด์สำหรับ [ชื่อผลิตภัณฑ์หรือบริการ] โดยระบุโปรแกรมสิทธิประโยชน์และกิจกรรมสร้างความสัมพันธ์กับลูกค้า”
- “วิเคราะห์ตลาดสำหรับ [ผลิตภัณฑ์หรือบริการใหม่] และประเมินความเป็นไปได้ทางธุรกิจ รวมถึงขนาดตลาด การเติบโต และการแข่งขัน”
- “สร้างแผนการบริหารจัดการวิกฤตสำหรับ [สถานการณ์ที่อาจเกิดขึ้น] ในอุตสาหกรรม [ชื่ออุตสาหกรรม] รวมถึงขั้นตอนการรับมือและการสื่อสาร”
- “วิเคราะห์ประสิทธิภาพของระบบ CRM ปัจจุบันของ [ชื่อบริษัท] และเสนอแนะวิธีการใช้ข้อมูลลูกค้าเพื่อเพิ่มยอดขายและความพึงพอใจ”
- “สร้างแผนการใช้ Influencer Marketing สำหรับ [ชื่อแบรนด์หรือผลิตภัณฑ์] โดยระบุประเภทของ Influencer เนื้อหาที่เหมาะสม และวิธีการวัดผล”
- “วิเคราะห์โอกาสในการทำ Cross-selling และ Upselling สำหรับ [ผลิตภัณฑ์หรือบริการ] และเสนอแนะกลยุทธ์การนำเสนอที่มีประสิทธิภาพ”
- “สร้างแผนการปรับปรุงประสิทธิภาพการดำเนินงานสำหรับ [ชื่อบริษัท] โดยระบุ 5 กระบวนการหลักที่ต้องปรับปรุงและวิธีการดำเนินการ”
- “วิเคราะห์แนวโน้มการเปลี่ยนแปลงของพฤติกรรมผู้บริโภคหลัง COVID-19 ในอุตสาหกรรม [ชื่ออุตสาหกรรม] และเสนอแนะวิธีการปรับตัวของธุรกิจ”
- “สร้างแผนการพัฒนาทักษะและความสามารถของพนักงานสำหรับ [ชื่อบริษัท] เพื่อรองรับการเปลี่ยนแปลงทางเทคโนโลยีและความต้องการของตลาด”
- “วิเคราะห์โอกาสในการสร้างพันธมิตรทางธุรกิจสำหรับ [ชื่อบริษัท] และเสนอแนะ 3 พันธมิตรที่มีศักยภาพพร้อมรูปแบบความร่วมมือ”
- “สร้างแผนการปรับปรุงการจัดการห่วงโซ่อุปทานเพื่อลดต้นทุนและเพิ่มประสิทธิภาพสำหรับ [ชื่อบริษัทหรือผลิตภัณฑ์]”
- “วิเคราะห์ความเป็นไปได้ในการใช้เทคโนโลยี AI และ Machine Learning ใน [กระบวนการทางธุรกิจ] และเสนอแนะแผนการนำมาใช้”
- “สร้างแผนการพัฒนาความยั่งยืนทางธุรกิจสำหรับ [ชื่อบริษัท] โดยระบุเป้าหมายด้านสิ่งแวดล้อม สังคม และบรรษัทภิบาล (ESG) พร้อมแนวทางการดำเนินงาน”


ขอขอบคุณที่ไว้วางใจ


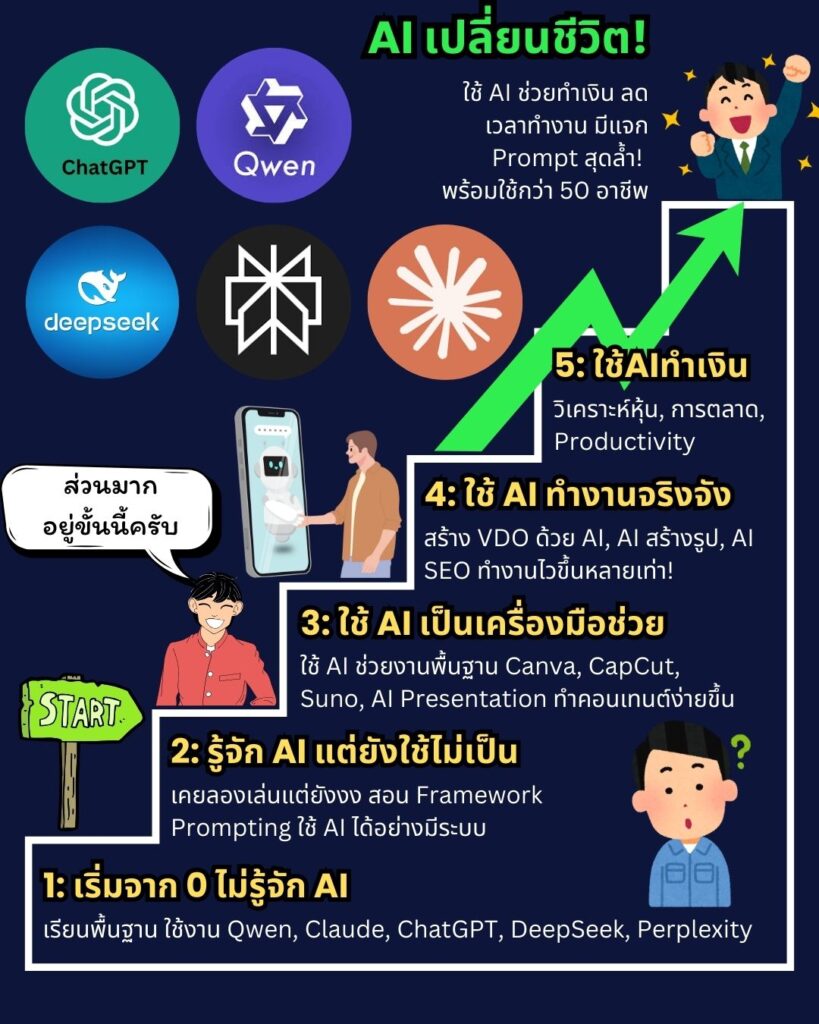
เราอยู่ในยุคที่ AI กำลังจะมาพลิกโลกการทำงาน


คอร์สนี้เหมาะสำหรับ
![]() ผู้ประกอบการ เจ้าของธุรกิจ ที่อยากนำ AI มาช่วยเพิ่มผลกำไร เพิ่มยอดขาย
ผู้ประกอบการ เจ้าของธุรกิจ ที่อยากนำ AI มาช่วยเพิ่มผลกำไร เพิ่มยอดขาย![]() มนุษย์เงินเดือน ที่ต้องการอัพสกิลตัวเอง เพื่อเพิ่มโอกาสในอาชีพการงาน
มนุษย์เงินเดือน ที่ต้องการอัพสกิลตัวเอง เพื่อเพิ่มโอกาสในอาชีพการงาน![]() ผู้ที่สนใจเทคโนโลยี AI และต้องการนำไปประยุกต์ใช้ในชีวิตประจำวัน
ผู้ที่สนใจเทคโนโลยี AI และต้องการนำไปประยุกต์ใช้ในชีวิตประจำวัน![]() นักลงทุน ที่ต้องการให้ AI ช่วยตัดสินใจในการลงทุน
นักลงทุน ที่ต้องการให้ AI ช่วยตัดสินใจในการลงทุน
สิ่งที่คุณจะได้เรียนรู้ในคอร์ส
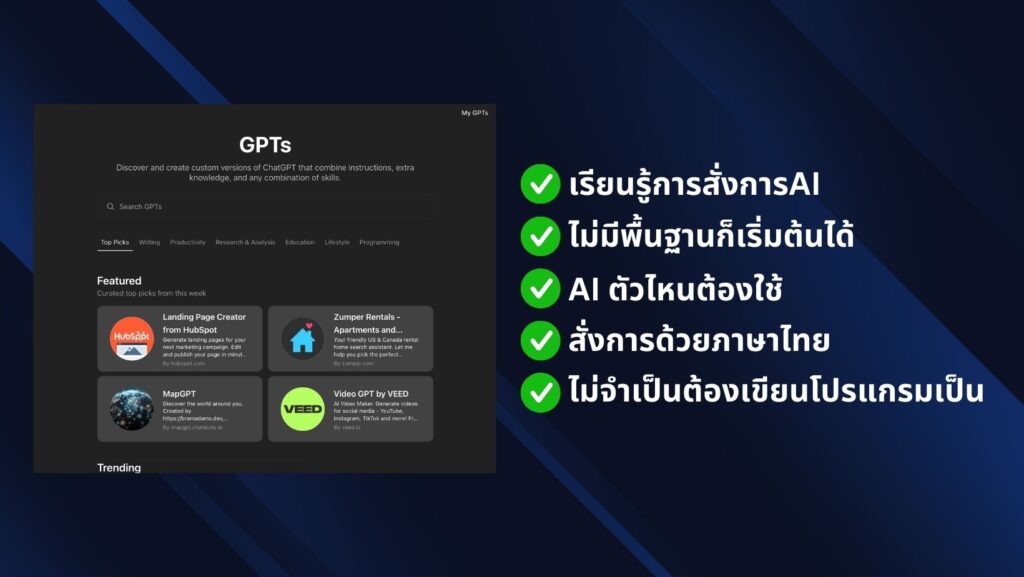
![]() ปูพื้นฐาน AI และ ChatGPT จากระดับเริ่มต้นจนใช้งานเป็น
ปูพื้นฐาน AI และ ChatGPT จากระดับเริ่มต้นจนใช้งานเป็น![]() เทคนิคการ Prompt ให้ AI ทำงานตามที่เราต้องการ
เทคนิคการ Prompt ให้ AI ทำงานตามที่เราต้องการ![]() ประยุกต์ใช้ AI ในด้านต่างๆ เช่น การตลาด, Content Creation, SEO
ประยุกต์ใช้ AI ในด้านต่างๆ เช่น การตลาด, Content Creation, SEO![]() สร้างรูปภาพ วิดีโอ ด้วย AI อย่าง DALL-E
สร้างรูปภาพ วิดีโอ ด้วย AI อย่าง DALL-E![]() เรียนรู้การใช้ AI ช่วยเหลือในการลงทุน
เรียนรู้การใช้ AI ช่วยเหลือในการลงทุน![]() AI อีกมากมายที่จะช่วยให้ชีวิดและธุรกิจของคุณง่ายขึ้น
AI อีกมากมายที่จะช่วยให้ชีวิดและธุรกิจของคุณง่ายขึ้น
🔥 สุดยอดความคุ้มของคอร์ส 🔥
✅ เรียน AI คุ้มที่สุด! 🎯 ได้คอร์สออนไลน์ที่อัปเดต ฟรีตลอดชีพ (ตอนนี้มี 100+ บทเรียนแล้ว!)
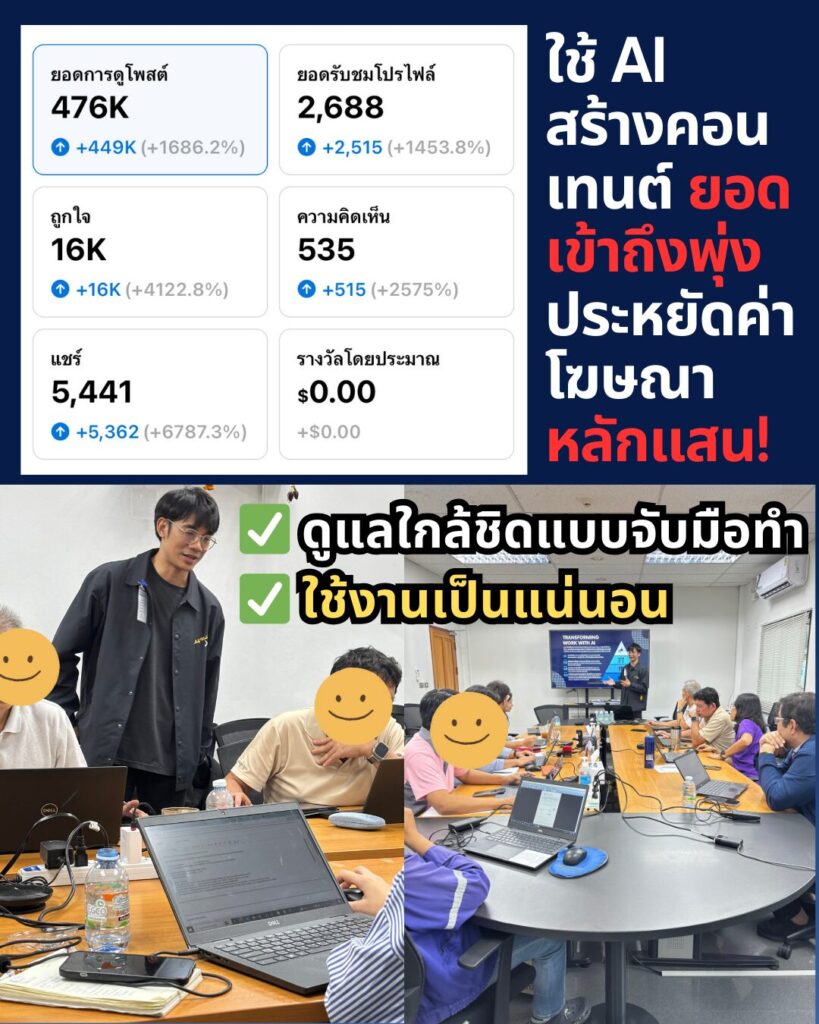
✅ Workshop จับมือทำ 1 ครั้ง 👨🏫 ใช้ AI เป็นแน่นอน! ทำจริง พร้อมโค้ชดูแลใกล้ชิด
✅ กลุ่มเล็ก สอนละเอียด! 👥 จำกัดแค่ 8 คนต่อรอบ ได้รับคำแนะนำแบบตัวต่อตัว
✅ AI ใช้งานได้จริง! 🚀 ทำคอนเทนต์ไวขึ้น / ทำ SEO / สร้างภาพ-วิดีโอ / เพิ่มประสิทธิภาพธุรกิจ
✅ สมัครครั้งเดียว คุ้มตลอดชีพ! 💰 ไม่มีรายเดือน อัปเดตเนื้อหาใหม่ฟรี!


และยังมีการประยุกต์ใช้อื่นๆอีกมากมาย
![]() ใช้ Gemini วางแผนการเรียน พร้อมตัวอย่างการใช้งาน
ใช้ Gemini วางแผนการเรียน พร้อมตัวอย่างการใช้งาน
📝 Workshop เพจสอนพิเศษคณิตศาสตร์
💬 workshop เพจ ธุรกิจสอนภาษาอังกฤษ
📝 ลองให้ ChatGPT สอนเขียน HTML CSS สอนดีไม่พอสรุปได้ดีด้วย
🚀 สอนสร้างหน้าเวปใน5นาที ด้วย ChatGPT ไม่ต้องเขียนCodeเองแม้แต่ตัวเดียว
🎥 AI สรุปคลิป youtube
💡 ใช้ ChatGPT ออกไอเดียทำคลิปวีดีโอ
🗺️ ChatGPT เขียน Mind Mapping ได้ด้วย
🔍 ใช้ Chat GPT ช่วยหารูปได้ด้วย
📚 ล้ำจัด ให้ AI แต่งนิทาน พร้อมภาพประกอบ คอมโบ ChatGPT+Midjourney+Canva
🖌️ ทำรูปสมุดระบายสี ด้วย Midjourney
📈 ใช้ ChatGPT เขียน SEO ตั้งแต่เริ่ม
📊 50 marketing Prompt
🖼️ สร้างรูปฟรีๆผ่าน ChatGPT
🖥️ ใช้ ChatGPT สร้างslide แบบ powerpoint
📺 สร้างคำอธิบายคลิป Youtube เพิ่ม SEO
เพื่อความชัดเจนว่าเรียนจบจะใช้ AI ทำอะไรได้บ้าง ไปรับชมเต็มๆได้เลยครับ
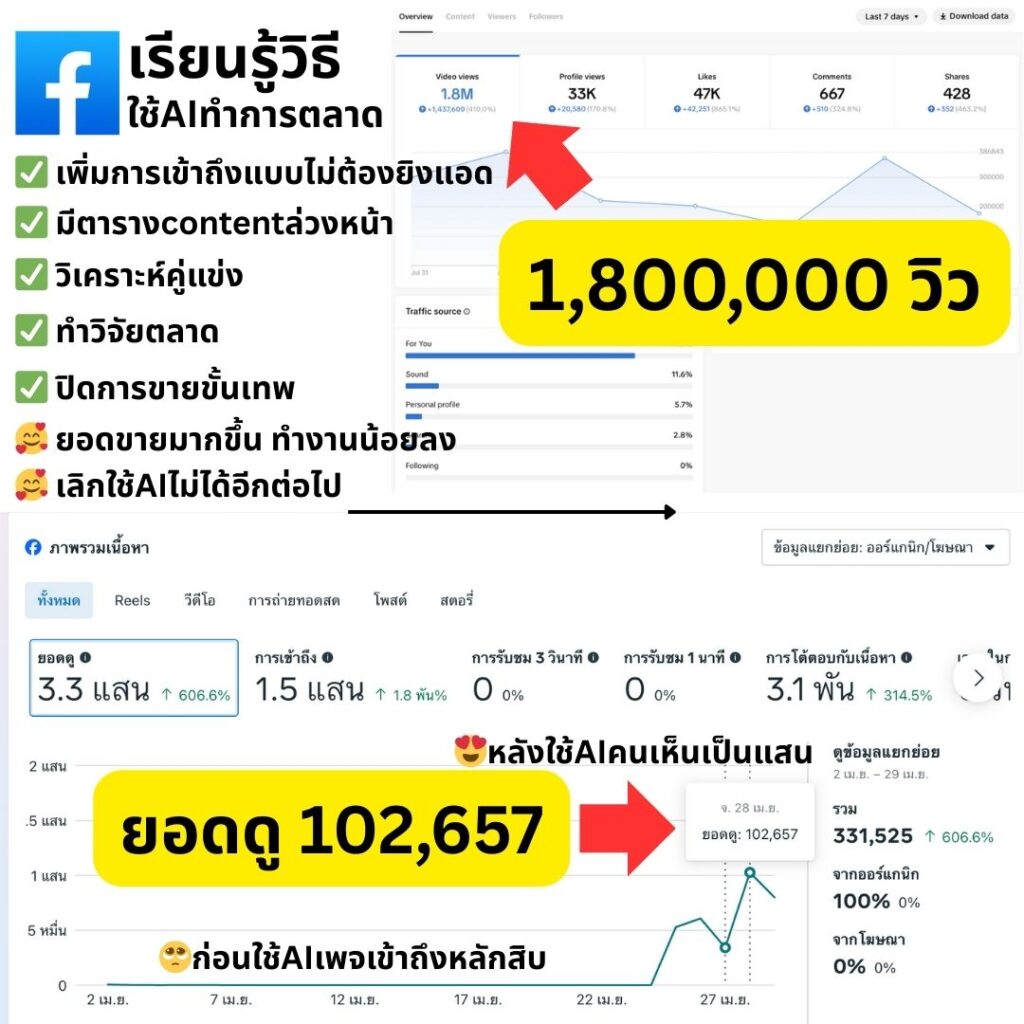
1.ใช้AIทำการตลาดออนไลน์
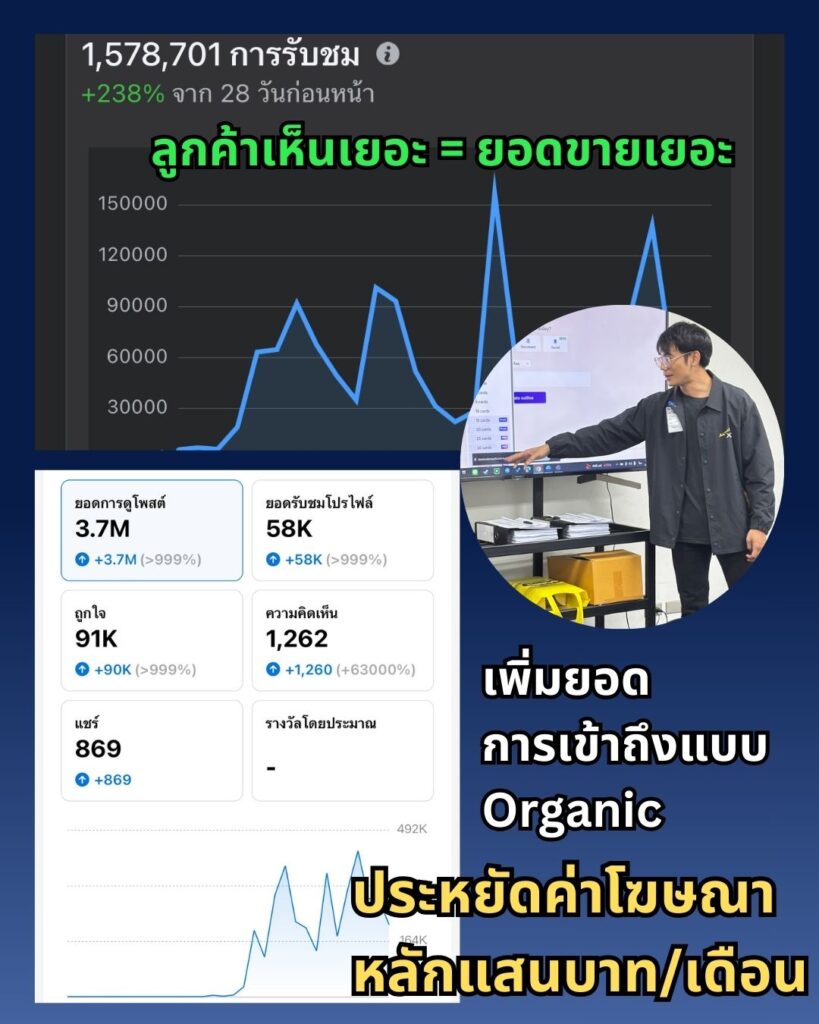
ทุกวันนี้นอกจากค่าต้นทุนสินค้าและบริการ ยังต้องมีค่าการตลาด ยิงAdsโฆษณา ซึ่งต้นทุกในส่วนนี้มันมีราคาแพงมากๆ แต่ว่าถ้าเราประยุกต์ใช้AIในการทำการตลาด เราสามารถลดต้นทุนตรงนี้ไปได้เยอะมากๆ หรือแทบไม่เสียเลย ซึ่งผมเอง ไม่ยิงAdsโฆษณา ก็กลายเป็นว่าต้นทุนในส่วนนี้ = 0 ครับ โดยการจะทำแบบนี้ได้ ถ้าไม่มีAI ผมก็คงทำไม่ได้เหมือนกัน
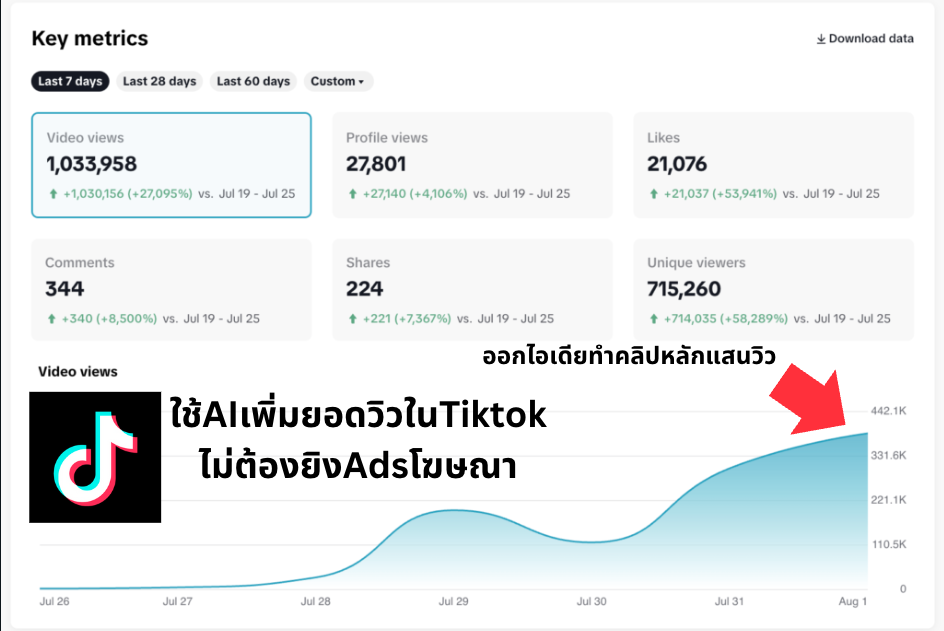
ไม่ได้เพียงแค่ช่วยได้แค่เพิ่มยอดวิวใน Tiktok แต่ยังนำมาปรับใช้ใน facebook IG ได้ด้วยครับ เรียกได้ว่า AI มันฉลาดล้ำลึกมากๆ เข้าใจว่าลูกค้าต้องการอะไร
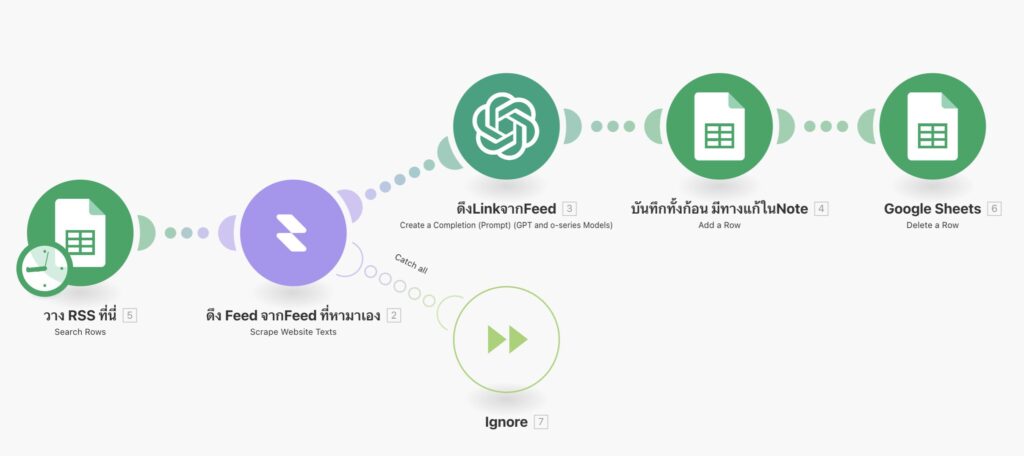
2.ใช้ AI ทำ Automation ง่ายกว่าเดิมหลายเท่า
หลังจากเราผ่านยุคของ ChatGPT มา โลกก็ไม่ได้หยุดแค่ตรงนั้นครับ — ตอนนี้ AI พัฒนาไปอีกขั้น คือ AI Automation
นึกภาพง่าย ๆ นะครับ… จากเดิมเราใช้ ChatGPT มาช่วยตอบคำถามหรือสร้างคอนเทนต์ มันก็ว่าสะดวกแล้ว แต่ต้องมากดเองทุกขั้นตอน บางทีก็กดไปงงไป เหนื่อยจนขี้เกียจใช้ไปซะงั้น
แล้วถ้าผมบอกว่า…
ตอนนี้เราสามารถ ตั้งระบบให้ AI ทำงานแทนเราแบบอัตโนมัติ ได้เลยล่ะ?
ยกตัวอย่างง่าย ๆ —
AI + Make.com = ผู้ช่วยส่วนตัวที่โพสต์คอนเทนต์ลงเพจให้คุณ ทุกวัน แบบที่ไม่ต้องแตะเลย!
AI จะช่วยคิดแคปชั่น หาไอเดีย แล้วโพสต์ให้ตรงเวลา ไม่ต้องมานั่งคิด นั่งทำเองให้เสียเวลา
ลองถามตัวเองดูครับว่า…
❌ เบื่อไหมกับการคิดคอนเทนต์ทุกวัน?
❌ เคยไหมโพสต์ไม่สม่ำเสมอ คนเห็นน้อย ยอดขายไม่มา?
❌ รู้สึกว่าเสียเวลาไปกับการทำคอนเทนต์ซ้ำ ๆ?
ถ้าใช่… ถึงเวลาปล่อยให้ AI Automation ทำงานแทนแล้วครับ
เซ็ตแค่ครั้งเดียว แล้วปล่อยให้ระบบวิ่งเองทุกวัน สบายกว่าเดิมเยอะ
3.ใช้AIทำ Presentation สุดสวย
มันคงจะดีมากๆ ถ้าเราสามารถลดเวลาการทำ powerpoint นานๆ แล้วมีเครื่องมือAI ที่กดแค่คลิกเดียวก็ได้ Slide สวยๆแบบนี้ออกมา ซึ่งเราจะมาเจาะลึกวิธีใช้งานกันครับ
✅ แค่พิมพ์หัวข้อ หรือโยนข้อมูลเข้าไป — ได้สไลด์สวยระดับมือโปรในไม่กี่คลิก
✅ ประหยัดเวลาไปได้เป็นชั่วโมง เอาไปทำอย่างอื่นที่สำคัญกว่า
✅ ได้ดีไซน์ที่ดูดี ทันสมัย ไม่ต้องมีพื้นฐานก็พรีเซนต์ได้แบบมืออาชีพ
✅ เหมาะกับทั้งงานเรียน งานขาย งานพรีเซนต์ลูกค้า
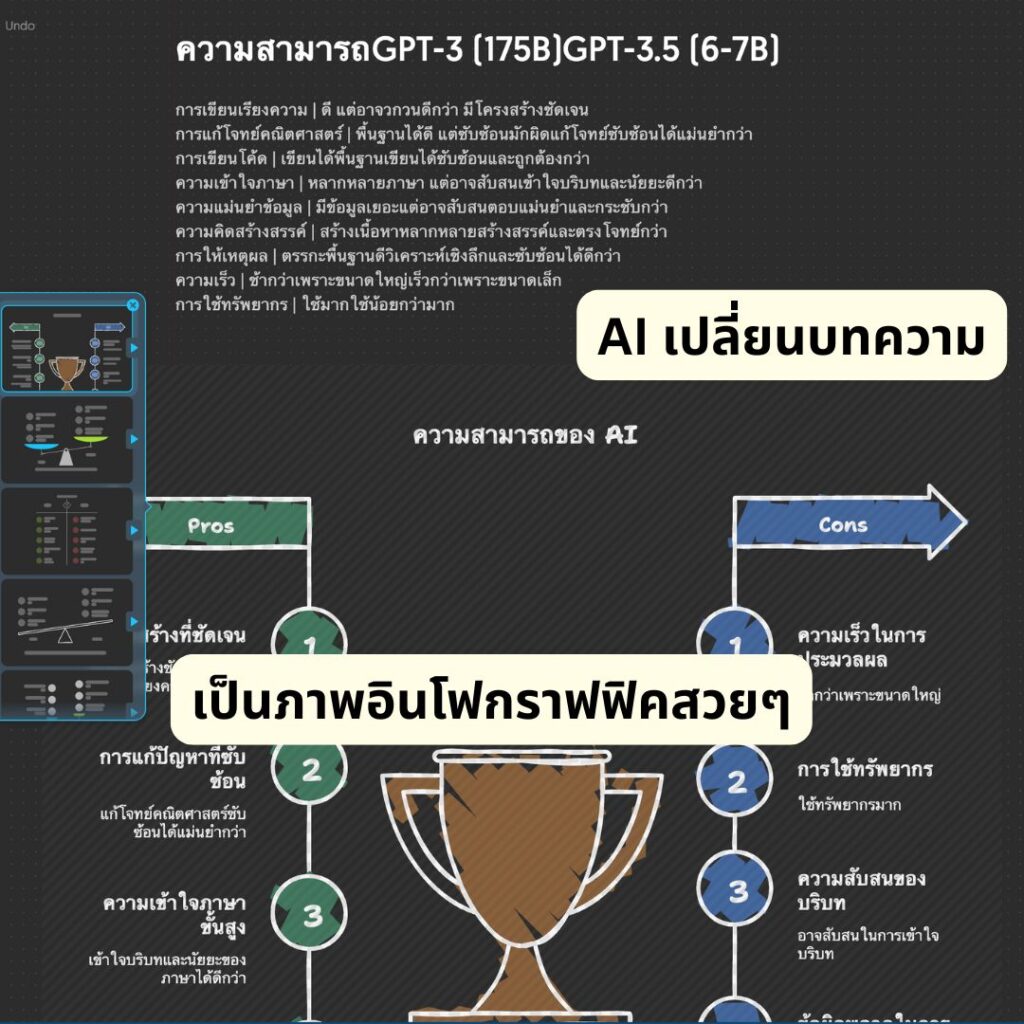
4.ใช้ AI ช่วยทำ “อินโฟกราฟิก” สวย ๆ แบบมือโปร ไม่ต้องมีสกิลดีไซน์!
หลายคนเริ่มรู้แล้วว่า AI ไม่ได้หยุดแค่การพิมพ์คำตอบครับ
ตอนนี้เราสามารถ “สร้างภาพที่สื่อสารได้ดีกว่าคำพูด” ด้วย AI ได้แล้ว โดยเฉพาะ ภาพแนวอินโฟกราฟิก
เพราะอะไรถึงควรเริ่มใช้?
✅ คนเราจดจำ “ภาพ” ได้มากถึง 65% แม้ผ่านไปแล้ว 3 วัน — ขณะที่ข้อความล้วนจำได้แค่ 10% เท่านั้น!
(ที่มา: Brain Rules, John Medina)
✅ อินโฟกราฟิกช่วยให้ “เนื้อหาแชร์บนโซเชียล” มากขึ้นถึง 3 เท่า
(ที่มา: HubSpot)
✅ เนื้อหาที่มี “ภาพประกอบเหมาะสม” ช่วยให้ อัตราการอ่านพุ่งขึ้นถึง 80%
(ที่มา: Nielsen Norman Group)
5.สร้างคลิปวิดีโอ และเพลง ด้วย AI ง่ายกว่าที่คิด
หลังจากเราใช้ ChatGPT ช่วยเขียน ช่วยคิดคอนเทนต์กันมาแล้ว… หลายคนอาจจะเริ่มสงสัยว่า
“แล้วถ้าอยากทำคลิป ทำเพลง ต้องใช้สกิลเยอะไหม?”
คำตอบคือ… ไม่ต้องเลยครับ
ตอนนี้โลก AI พัฒนาไปไกลกว่านั้นแล้ว —
AI บางตัวแค่เราใส่ไอเดียเข้าไปไม่กี่คำ ก็สามารถสร้างวิดีโอพร้อมภาพ เสียง และการตัดต่อเบื้องต้นให้อัตโนมัติ
หรือถ้าอยากได้ “เพลงที่แต่งขึ้นใหม่หมด” แค่พิมพ์ว่าอยากได้อารมณ์แบบไหน —
AI ก็จะสร้างเมโลดี้ ทำนอง และแม้กระทั่งเสียงร้องมาให้เสร็จ!
ลองนึกภาพตามนะครับ…
✅ อยากทำคลิปโปรโมตสินค้า → พิมพ์ไอเดีย → ได้คลิปพร้อมเสียงใน 5 นาที
✅ อยากมีเพลงประกอบคลิปของตัวเอง → แค่บอกอารมณ์ → ได้เพลงลิขสิทธิ์แท้ ๆ ใช้ได้ทันที
✅ อยากเป็น YouTuber, นักแต่งเพลง หรือครีเอเตอร์ ก็เริ่มได้เลย ไม่ต้องรอใคร ไม่ต้องมีสตูดิโอ
ทั้งหมดนี้… แค่ใช้เครื่องมือ AI ที่ “ฉลาดพอจะเป็นทีมโปรดักชันให้เรา” ได้ทันทีในไม่กี่คลิก
ตัวอย่างด้านล่างนี้เลยครับ
6.สร้างนิทาน AI
@thailand_ai ไอส์อยากเป็นนักบินอวกาศ
♬ เสียงต้นฉบับ – อ.ต้น Thailand-AI
7.สร้างคลิปโปรโมทสินค้า

8.สร้างหนังสั้นโดยใช้ตัวเอาเราเองเป็นพระเอกได้

คอร์สนี้…คุ้มเกินคาด!

✅ วิดีโอสอน 70 บทเรียน ความยาวรวมกว่า 8 ชั่วโมง 15 นาที
✅ บทความประกอบการเรียนกว่า 194 บทความ
✅ เนื้อหา AI ช่วยวิเคราะห์หุ้น 23 ตอนเจาะลึก
ของแถมสุดพิเศษ
✅ แจกฟรี 23 Ebook รวม Prompt ใช้งานได้ทันที
✅ รวมเครื่องมือ AI กว่า 100 ตัว ครอบคลุมหลายหมวด
✅ เพิ่มพลังสร้างภาพด้วย AI ช่วยทำรูปอีก 20 ตัว
คุณยังได้รับสิทธิ์เข้าเรียนสดแบบ “จับมือทำ”
📌 ไม่ต้องกลัวว่าจะใช้ไม่เป็น
📌 ไม่ต้องนั่งงมคนเดียว
เพราะเราจะสอนทุกขั้นตอน พร้อมตอบทุกคำถาม
ให้คุณใช้งาน AI ได้คล่องเหมือนมืออาชีพ ตั้งแต่วันแรกที่เริ่มเรียน!


เนื้อหาการสอนสด (Workshop 4 ชั่วโมง)
1. ChatGPT & Prompt ระดับมืออาชีพ
- รู้จักการเขียน Prompt ที่ได้ผลลัพธ์ตรงใจ ไม่ใช่แค่ถามแบบทั่วไป
- เทคนิคปรับ Prompt ให้ AI ทำงานแทนคุณได้อย่างแม่นยำ
2. สร้างรูปโฆษณาสินค้าโดย AI
- ใช้ AI ออกแบบภาพโฆษณา สร้างแบรนด์ สินค้าได้เองในคลิกเดียว
- เทคนิคปรับรายละเอียดให้ตรงกับความต้องการ
3. แต่งเพลงด้วย AI ในไม่กี่นาที
- สร้างเมโลดี้ เนื้อเพลง สไตล์ที่ชอบแบบไม่ต้องมีพื้นฐานดนตรี
4. สร้างนิทาน AI สไตล์คุณ
- ใช้ AI ช่วยแต่งนิทานพร้อมคลิปประกอบ สำหรับทำคอนเทนต์หรือขายอีบุ๊ก
5. Make Automation – ทำงานอัตโนมัติด้วย AI
- ปลดล็อกการทำงานซ้ำๆ ให้ AI ทำแทน ตั้งแต่ตอบแชท สร้างรายงาน จัดการข้อมูล
เหมาะกับใครบ้าง?
✔️ คนที่เพิ่งเริ่มใช้ AI แต่ยังใช้ไม่คล่อง
✔️ เจ้าของธุรกิจที่อยากลดต้นทุนด้วย AI
✔️ คนทำคอนเทนต์ที่ต้องการสร้างงานเร็วขึ้น
✔️ ผู้สนใจเทคโนโลยีที่ไม่อยากตกเทรนด์

ทำไมต้องเรียนสด?
🔥 ถามตอบได้ทันที – ไม่ต้องมานั่งงงเองที่บ้าน
🔥 ฝึกจริงกับเคสตัวอย่าง – พร้อมไฟล์ Workshop ให้กลับไปทบทวน
🔥 กลุ่มเล็กเพียง 8 คน – ดูแลอย่างเต็มที่
สถานที่เรียน ร้าน Paulsteak house เลี่ยงเมืองปากเกร็ด 46 นนทบุรี
📌แผนที่ : https://g.co/kgs/riH9PMw
รอบเรียนครั้งต่อไป
รุ่น 5 : 14 มิถุนายน 2568 (ว่าง2ที่)
รุ่น 6 : 29 มิถุนายน 2568
หากยังไม่สะดวกมา สามารถเก็บสิทธิ์ไว้รอบถัดไปได้ครับ
ทั้งหมดนี้เพียง 3,990 บาท ก่อนปรับเป็นราคาเต็ม 8,990 ในอนาคต

เนื้อหาที่อัพเดทฟรี เดือนพฤษภาคม
1.[ChatGPT 2025 Part 1] ส่องฟีเจอร์ใหม่! อัปเดตล่าสุดของ ChatGPT ปีนี้มีอะไรน่าลอง
2.เปลี่ยนข้อมูลให้ปัง! สร้าง Dashboard สุดโปรด้วย Qwen3
3.ใช้ ChatGPT แบบประหยัดเว่อร์! เทคนิคเติมเงินที่คุ้มที่สุด
4.ให้ AI ขายของแทน! ใช้ ChatGPT เขียนโพสต์แบบมือโปร
5.เขียนแคปชั่นขายของ 10 ชิ้นในพริบตา! ด้วย Automation + AI
6.AI ช่วยจัดหน้าสวย! สร้างอินโฟกราฟิกเก๋ ๆ ด้วยเครื่องมืออัจฉริยะ
7.[Gamma AI Part 1] เริ่มต้นใช้ Gamma AI สร้างสไลด์สุดเท่ ไม่ต้องแตะ PowerPoint
8.[Gamma AI Part 2] ปั้นพรีเซนต์ระดับโปรด้วย Gamma AI แบบไม่ต้องมีดีไซน์พื้นฐาน
9.[Gamma AI Part 3] เทคนิคขั้นสูง! ดันไอเดียให้โดนใจด้วย Gamma AI
10.รู้จัก Claude API – อีกหนึ่งขุมพลัง AI ที่ไม่ควรมองข้าม
11.[Perplexity Part 1] ใช้ Perplexity หาข้อมูลแบบเทพ เร็วกว่า Google
12.[Perplexity Part 2] ปั้นงานวิจัย & คอนเทนต์ด้วย Perplexity แบบจัดเต็ม