
ผมได้ไปเจอคลิปนี้ มีการแจกระบบเทรดของลุงโฉลก ซึ่งเป็น CDC ActionZone ก็เลยเอาไปปรับแต่งเพิ่มนิดๆหน่อยๆ ให้ทำการเปิดสัญญาณซื้อขาย กับเพิ่มสัญลักษณ์การใช้งานให้ง่ายขึ้น

1.เปิดบัญชีทดลอง
ทดลองเทรด Binaryoption (เหมาะก็ต่อเมื่อเปิดดูสัญญาณ TF 1H ขึ้นไป) ฝึกฝนเทรดฟรีคลิกที่นี่
ทดลองเทรดForex (ใช้ได้ดีกับสัญญาณนี้) ฝึกฝนเทรดฟรีคลิกที่นี่
2.ไปที่ https://www.tradingview.com/ แล้วเอาCodeที่ผมแจก ก็อปวางได้เลยครับ
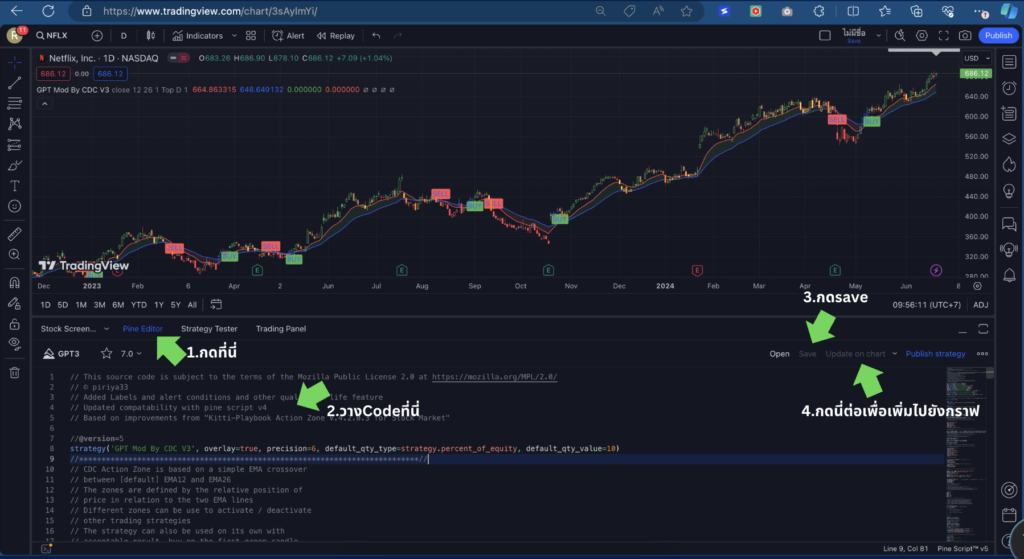
// This source code is subject to the terms of the Mozilla Public License 2.0 at https://mozilla.org/MPL/2.0/
// © piriya33
// Added Labels and alert conditions and other quality of life feature
// Updated compatability with pine script v4
// Based on improvements from "Kitti-Playbook Action Zone V.4.2.0.3 for Stock Market"

//@version=5
strategy('GPT Mod By CDC V3', overlay=true, precision=6, default_qty_type=strategy.percent_of_equity, default_qty_value=10)
//****************************************************************************//
// CDC Action Zone is based on a simple EMA crossover
// between [default] EMA12 and EMA26
// The zones are defined by the relative position of
// price in relation to the two EMA lines
// Different zones can be use to activate / deactivate
// other trading strategies
// The strategy can also be used on its own with
// acceptable result, buy on the first green candle
// and sell on the first red candle
//****************************************************************************//
//****************************************************************************//
// Define User Input Variables

xsrc = input.source(title='Source Data', defval=close)
xprd1 = input.int(title='Fast EMA period', defval=12)
xprd2 = input.int(title='Slow EMA period', defval=26)
xsmooth = input.int(title='Smoothing period (1 = no smoothing)', defval=1)
fillSW = input.bool(title='Paint Bar Colors', defval=true)
fastSW = input.bool(title='Show fast moving average line', defval=true)
slowSW = input.bool(title='Show slow moving average line', defval=true)
labelSwitch = input.bool(title='Turn on assistive text', defval=true)
plotSigsw = input.bool(title='Plot Buy/Sell Signals? ', defval=true)
plotRibsw = input.bool(title='Plot Buy/Sell Ribbon', defval=false)
plotRibbonPos = input.string(title='Ribbon Position', options=['Top', 'Bottom'], defval='Top')

xfixtf = input.bool(title='** Use Fixed time frame Mode (advanced) **', defval=false)
xtf = input.timeframe(title='** Fix chart to which time frame ? **)', defval='D')

plotSig2sw = input.bool(title='Plot momentum based Buy/Sell Signals? ', defval=false)
plotSig2lv = input.int(title='Set signal threshold (higher = stricter)', defval=1, minval=0, maxval=1)

//****************************************************************************//
//Calculate Indicators

f_secureSecurity(_symbol, _res, _src) => request.security(_symbol, _res, _src[1], lookahead = barmerge.lookahead_on) // Using f_secureSecurity to avoid repainting

xPrice = ta.ema(xsrc, xsmooth)


FastMA = xfixtf ?
 ta.ema(f_secureSecurity(syminfo.tickerid, xtf, ta.ema(xsrc, xprd1)), xsmooth)
 :
 ta.ema(xPrice, xprd1)


SlowMA = xfixtf ?
 ta.ema(f_secureSecurity(syminfo.tickerid, xtf, ta.ema(xsrc, xprd2)), xsmooth)
 :
 ta.ema(xPrice, xprd2)

Bull = FastMA > SlowMA
Bear = FastMA < SlowMA

//****************************************************************************//
// Define Color Zones

Green = Bull and xPrice > FastMA  // Buy
Blue = Bear and xPrice > FastMA and xPrice > SlowMA  //Pre Buy 2
LBlue = Bear and xPrice > FastMA and xPrice < SlowMA  //Pre Buy 1

Red = Bear and xPrice < FastMA  // Sell
Orange = Bull and xPrice < FastMA and xPrice < SlowMA  // Pre Sell 2
Yellow = Bull and xPrice < FastMA and xPrice > SlowMA  // Pre Sell 1

//****************************************************************************//
// Display color on chart


bColor = Green ? color.green :
 Blue ? color.blue :
 LBlue ? color.aqua :
 Red ? color.red :
 Orange ? color.orange :
 Yellow ? color.yellow :
 color.black
barcolor(color=fillSW ? bColor : na)

//****************************************************************************//
// Display MA lines

FastL = plot(fastSW ? FastMA : na, 'Fast EMA', color=color.new(color.red, 0), style = xfixtf ? plot.style_stepline : plot.style_line)
SlowL = plot(slowSW ? SlowMA : na, 'Slow EMA', color=color.new(color.blue, 0), style = xfixtf ? plot.style_stepline : plot.style_line)
fillcolor = Bull ? color.new(color.green,90) : Bear ? color.new(color.red,90) : color.new(color.black,90) // fillcolor = Bull ? color.green : Bear ? color.red : color.black
fill(FastL, SlowL, fillcolor) // fill(FastL, SlowL, fillcolor, transp=90)

//****************************************************************************//
// Define Buy and Sell condition
// This is only for thebasic usage of CDC Actionzone (EMA Crossover)
// ie. Buy on first green bar and sell on first red bar

buycond = Green and Green[1] == 0
sellcond = Red and Red[1] == 0

bullish = ta.barssince(buycond) < ta.barssince(sellcond)
bearish = ta.barssince(sellcond) < ta.barssince(buycond)

buy = bearish[1] and buycond
sell = bullish[1] and sellcond

bColor_BullBear = bullish ? color.green : bearish ? color.red : color.black

//****************************************************************************//
// Plot Buy and Sell point on chart

plotshape(plotSigsw ? buy : na,
 style=shape.labelup,
 title='Buy Signal',
 location=location.belowbar,
 color=color.new(color.green, 0),
 text="BUY")
plotshape(plotSigsw ? sell : na,
 style=shape.labeldown,
 title='Sell Signal',
 location=location.abovebar,
 color=color.new(color.red, 0),
 text="SELL")

// Display Buy/Sell Ribbon


plotshape(plotRibsw ? plotRibbonPos == 'Top' ? close : na : na,
 style=shape.square,
 title='Buy/Sell Ribbon',
 location=location.top,
 color=bColor_BullBear)

plotshape(plotRibsw ? plotRibbonPos == 'Bottom' ? close : na : na,
 style=shape.square,
 title='Buy/Sell Ribbon',
 location=location.bottom,
 color=bColor_BullBear)


//****************************************************************************//
// Label

labelstyle = close > SlowMA ? label.style_label_down : label.style_label_up
labelyloc = close > SlowMA ? yloc.abovebar : yloc.belowbar
labeltcolor = buy ? color.black :
 sell ? color.white :
 close > close[1] ? color.green :
 color.red
labelbgcolor = buy ? color.green : sell ? color.red : color.silver
labeltext = buy ? 'BUY next bar\n' : sell ? 'SELL next bar\n' : ' '
trendText = bullish ? 'bullish' : bearish ? 'bearish' : 'sideways'


l1 = label.new(bar_index, na,
 text=labeltext + syminfo.ticker + ' ' + str.tostring(close) + ' ' + syminfo.currency + '\n currently in a ' + trendText + ' trend \n',
 color=labelbgcolor,
 textcolor=labeltcolor,
 yloc=labelyloc,
 style=labelstyle)

label.delete(labelSwitch ? l1[1] : l1)

// Momentum Signal using StochRSI

// Adds a momentum based signal following trends to the script
// Default is hidden, only use with caution
// Parameters for STOCH RSI is hard-coded to avoid cluttering the input screen further
// If you need to change anything, make a copy of the code and change it.
// Inputs are commented out, to enable them comment out the hard coded variables first!

// fixed inputs //

smoothK = 3
smoothD = 3
RSIlen = 14
STOlen = 14
SRsrc = close
OSlevel = 30
OBlevel = 70

// User inputs // // COMMENT ABOVE VARIABLES FIRST!!

// smoothK = input(3,"StochRSI smooth K",type=input.integer,minval=1)
// smoothD = input(3,"StochRSI smooth D",type=input.integer,minval=1)
// RSIlen = input(14,"RSI length",type=input.integer,minval=1)
// STOlen = input(14,"Stochastic length",type=input.integer,minval=1)
// SRsrc = input(close,"Source for StochasticRSI",type=input.source)
// OSlevel = input(30,"Oversold Threshold",type=input.float,minval=0.00)
// OBlevel = input(70,"Oversold Threshold",type=input.float,minval=0.00)

// calculations //
rsi1 = ta.rsi(SRsrc, RSIlen)
k = ta.sma(ta.stoch(rsi1, rsi1, rsi1, STOlen), smoothK)
d = ta.sma(k, smoothD)

// storsiBuySig =  if bullish
//     if (d < OSlevel and crossover(k,d))
//         3
//     else if crossover(k,OSlevel)
//         2
//     else if d > OSlevel and crossover(k,d)
//         1
//     else
//         0
// else
//     0

crossover_1 = ta.crossover(k, d)
crossover_2 = ta.crossover(k, d)
iff_1 = d > OSlevel and crossover_2 ?
 1 : 0
iff_2 = d < OSlevel and crossover_1 ?
 2 : iff_1
storsiBuySig = bullish ? iff_2 : 0

crossunder_1 = ta.crossunder(k, d)
crossunder_2 = ta.crossunder(k, d)
iff_3 = d < OBlevel and crossunder_2 ?
 1 : 0
iff_4 = d > OBlevel and crossunder_1 ?
 2 : iff_3
storsiSellSig = bearish ? iff_4 : 0

plotshape(plotSig2sw ? storsiBuySig > plotSig2lv ? storsiBuySig : na : na,
 'Buy more signals', style=shape.triangleup,
  location=location.belowbar, color=color.new(color.teal, 0))
plotshape(plotSig2sw ? storsiSellSig > plotSig2lv ? storsiSellSig : na : na,
 'Sell more signals', style=shape.triangledown,
  location=location.abovebar, color=color.new(color.orange, 0))


//****************************************************************************//
// Alert conditions

alertcondition(buy,
 title='*Buy Alert',
 message='Buy {{exchange}}:{{ticker}}')

alertcondition(sell,
 title='*Sell Alert',
 message='Sell {{exchange}}:{{ticker}}')

alertcondition(bullish,
 title='is Bullish')

alertcondition(bearish,
 title='is Bearish')

alertcondition(Green,
 title='is Green')

alertcondition(Blue,
 title='is Blue (Strong Rally)')

alertcondition(LBlue,
 title='is Light Blue (Rally)')

alertcondition(Red,
 title='is Red')

alertcondition(Orange,
 title='is Orange (Strong Dip)')

alertcondition(Yellow,
 title='is Yellow (Dip)')


//****************************************************************************//

// Entry and Exit Strategy
if (buy)
    strategy.entry("Buy", strategy.long)

if (sell)
    strategy.close("Buy")
ใช้ AI ทำงานได้จริง ตั้งแต่พื้นฐานถึง Automation
หลักสูตรออนไลน์สำหรับเจ้าของธุรกิจ นักการตลาด ครีเอเตอร์ ฟรีแลนซ์ และคนทำงานที่อยากใช้ AI ช่วยคิดงาน ทำคอนเทนต์ วางแผนการตลาด สร้างภาพ วิดีโอ และเริ่มต่อระบบอัตโนมัติอย่างเป็นขั้นตอน
เรียนแล้วควรนำ AI ไปใช้กับงานจริงได้ทันที
คอร์สนี้ออกแบบให้เริ่มจากพื้นฐานที่จำเป็น แล้วค่อยพาไปสู่การประยุกต์ใช้กับงานธุรกิจ การตลาด คอนเทนต์ และระบบอัตโนมัติ โดยมีตัวอย่างให้ทำตามเป็นขั้นตอน
เลือกใช้เครื่องมือ AI ได้ถูกงาน
เข้าใจ ChatGPT, Gemini, Perplexity, My GPTs และพื้นฐานการเขียน Prompt ให้ได้คำตอบที่นำไปใช้ต่อได้
ทำคอนเทนต์ได้เป็นระบบขึ้น
ใช้ AI ช่วยคิดโพสต์ เขียนแคปชั่น ทำภาพ วิดีโอ สคริปต์ และจัดเตรียมไอเดียคอนเทนต์สำหรับใช้งานต่อเนื่อง
ต่อยอดกับงานขายและการตลาด
มีตัวอย่างสำหรับ SEO เพจขายของ YouTube Customer Service การวางแผนธุรกิจ และ Prompt สำหรับงานการตลาดหลายรูปแบบ
เริ่มลดงานซ้ำด้วย Automation
เรียนแนวคิดและตัวอย่างการใช้ n8n, Make, Claude Code, Workflow การโพสต์ และระบบอัตโนมัติที่นำไปปรับใช้กับงานของตัวเองได้

9 Module ที่พาคุณใช้ AI ได้ครบกว่าแค่ถามตอบ
เนื้อหาถูกจัดจากพื้นฐาน เครื่องมือหลัก ตัวอย่างธุรกิจ Prompt สร้างสื่อ เครื่องมือเสริม การเงิน และ Automation เพื่อให้เรียนต่อเนื่องได้โดยไม่กระโดดข้ามขั้น
ปูพื้นฐาน AI
เริ่มจากเครื่องมือหลักและวิธีคิดที่ต้องมี เพื่อไม่ให้ใช้ AI แบบลองผิดลองถูก
- ChatGPT, Gemini/Bard, Bing และ Perplexity
- พื้นฐาน Prompt, Plugin และ My GPTs
- Midjourney, KLING AI และ Meta AI
โปรเจกต์ฝึกทำธุรกิจจริง
ตัวอย่างงานที่ใกล้กับธุรกิจจริง ช่วยให้เห็นวิธีนำ AI ไปปรับใช้กับงานของตัวเองได้ง่ายขึ้น
- ธุรกิจสอนภาษา การตลาด เพจข่าว YouTube
- Customer Service, DALL-E, Gemini, Dashboard
- สคริปต์ช่วยทำคลิปและงานซ้ำบน Mac
การประยุกต์ใช้ AI
รวมบทเรียนใช้งานจริงหลากหลายสาย ตั้งแต่งานเขียน งานเว็บ การตลาด ภาพ วิดีโอ และงานข้อมูล
- เขียนเว็บ SEO สคริปต์ YouTube และบทความขาย
- สร้าง Logo, Pixel Art, ห้อง 3D, Video และ Avatar
- Make.com, Gamma, Qwen, Claude, Deepseek
คลัง Prompt พร้อมใช้
มี Prompt จัดหมวดสำหรับงานขาย งานการตลาด งานวางแผน และงานวิเคราะห์ เพื่อช่วยให้เริ่มงานได้เร็วขึ้น
- Marketing, Blog, Ads, YouTube, Facebook
- High-ticket Sales, Copywriting, Strategy
- Data Analytics, Finance และ Research
คำสั่งสร้างรูป AI
คลังคำสั่งสำหรับคนทำแบรนด์ คอนเทนต์ ร้านค้า และนักออกแบบที่อยากผลิตภาพไวขึ้น
- Sticker, Wallpaper, ท่องเที่ยว, ร้านกาแฟ
- Prompt ภาพการตลาดและภาพคุมโทน
- รวม Prompt สร้างรูป 1,000+ สไตล์
รวม eBook และไฟล์เสริม
คลังอ่านต่อสำหรับเพิ่มผลิตภาพ วางแผนธุรกิจ การตลาด การเงิน และการใช้ ChatGPT ในชีวิตจริง
- 600+ Business Prompts และ 299 Marketing Prompts
- 300 ไอเดียต่อยอดงานและธุรกิจด้วย ChatGPT
- Productivity, Customer Support, LINE, TikTok, Facebook
AI การเงินและ Trading
เรียนรู้การใช้ AI เพื่อช่วยศึกษาแนวคิดการวิเคราะห์ตลาดและเครื่องมือเทคนิคอลอย่างเป็นระบบ
- Pinescript, RSI/MFI, แนวรับแนวต้าน
- Golden Cross, Zigzag, Kernel, Volume Profile
- Candlestick Pattern และระบบเทรดจาก ChatGPT
รวมเครื่องมือ AI
ช่วยประหยัดเวลาหาเครื่องมือ มีหมวดให้เลือกตามงานจริงที่ต้องทำ
- เขียนและสร้างเนื้อหา, ดีไซน์, ภาพ, วิดีโอ, เสียง
- ธุรกิจ การตลาด Productivity และ Chatbot
- เว็บ No-code, PDF, Quiz และเครื่องมือเฉพาะทาง
AI Automation
ต่อยอดจากการใช้ AI ทีละงาน ไปสู่การเชื่อมเครื่องมือและลดขั้นตอนซ้ำๆ ด้วยระบบอัตโนมัติ
- Claude Code, Skill, Antigravity และงานโค้ด
- Caption Auto, ข่าวอัตโนมัติ, Adverra, แชร์โพสต์
- n8n, Make, Podcast to YouTube และตัวอย่างระบบ E-commerce
คอร์สออนไลน์พร้อมทรัพยากรสำหรับนำไปใช้ต่อ
นอกจากวิดีโอเรียน ยังมี Prompt, eBook, รายชื่อเครื่องมือ และตัวอย่าง Workflow เพื่อให้ผู้เรียนนำไปปรับใช้กับงานจริงได้ง่ายขึ้น
ระบบเรียนออนไลน์ครบชุด
เรียนตั้งแต่พื้นฐาน เครื่องมือหลัก การประยุกต์ใช้ ไปจนถึง Automation ดูซ้ำได้ตามเวลาที่สะดวก
Prompt และ Template พร้อมใช้
ครอบคลุมงานขาย โฆษณา แคปชั่น บทความ SEO, YouTube, Research และการวางกลยุทธ์
เครื่องมือและไฟล์เสริม
รวม eBook, รายชื่อเครื่องมือ AI, Prompt สร้างรูป และตัวอย่าง Workflow สำหรับศึกษาเพิ่มเติม
อัปเดตเนื้อหาใหม่ตลอดชีพ
เมื่อมีการเพิ่มบทเรียนใหม่ ผู้เรียนสามารถกลับมาเรียนเนื้อหาอัปเดตได้ตามสิทธิ์ของคอร์ส
- คอร์สออนไลน์ AI Master Class 2026 ครบทุก Module
- ดูซ้ำได้ตลอดชีพ ไม่มีหมดอายุ
- รับอัปเดตบทเรียนใหม่ในอนาคต
- Prompt, eBook, เครื่องมือ และไฟล์ Workflow ที่เกี่ยวข้อง
- เหมาะกับคนทำธุรกิจ ครีเอเตอร์ ฟรีแลนซ์ และคนทำงาน
สิ่งที่ได้ในราคา 4,990
รวมเนื้อหาเรียนและทรัพยากรประกอบที่ช่วยให้เริ่มใช้ AI กับงานได้หลายด้าน โดยไม่ต้องเสียเวลารวบรวมเองจากหลายแหล่ง
พื้นฐาน AI และ Prompt
พื้นฐาน ChatGPT, Gemini, Perplexity, Prompt, My GPTs และการใช้งาน AI ตัวหลัก
โปรเจกต์ตัวอย่างธุรกิจ
เคสสอนภาษา การตลาด เพจข่าว YouTube Customer Service และ Dashboard
คลัง Prompt พร้อมใช้
คลัง Prompt สำหรับ Marketing, Ads, SEO, Sales, Finance, Research และ Strategy
ชุดคำสั่งสำหรับครีเอเตอร์
Prompt สร้างรูป 1,000+ แบบ, ไอเดียคอนเทนต์, ภาพ, วิดีโอ และคำสั่งสำหรับครีเอเตอร์
เริ่มต้น Automation
n8n, Make, Claude Code, Caption Auto, Podcast to YouTube และตัวอย่าง Workflow ต่อระบบ
เครื่องมือ AI และ eBook
รวมเครื่องมือ AI หลายหมวดและ eBook สำหรับ Productivity, Business, Marketing และ Finance
คอร์สนี้เหมาะกับใคร
เหมาะกับคนที่อยากเรียน AI แบบนำไปใช้กับงานประจำ ธุรกิจ หรือคอนเทนต์ของตัวเอง มากกว่าการเรียนทฤษฎีอย่างเดียว
ตอบข้อสงสัยก่อนสมัคร
ไม่มีพื้นฐาน AI เรียนได้ไหม?
เรียนได้ เพราะ Module 1 ปูตั้งแต่เครื่องมือหลัก วิธีเขียน Prompt และวิธีเลือกใช้ AI ให้เหมาะกับงาน ก่อนพาไปโปรเจกต์ฝึกทำและ Automation
ราคา 4,990 ได้อะไรบ้าง?
ได้คอร์สออนไลน์ทั้ง 9 Module, Prompt Library, eBook, รายชื่อเครื่องมือ AI, คำสั่งสร้างภาพ, เนื้อหา Automation และอัปเดตใหม่ในอนาคต
สมัครแล้วดูได้นานแค่ไหน?
ดูซ้ำได้ตลอดชีพ ไม่มีรายเดือน และเมื่อมีบทเรียนอัปเดตใหม่ก็สามารถเรียนเพิ่มได้ตามสิทธิ์ของคอร์ส
เริ่มใช้ AI กับงานจริงอย่างเป็นระบบ
สมัครคอร์สออนไลน์ AI Master Class 2026 ราคา 4,990 บาท เรียนได้ตามเวลา และกลับมาดูซ้ำได้เมื่อต้องใช้งาน