ในยุคดิจิทัลที่การแข่งขันทางธุรกิจออนไลน์สูงขึ้นเรื่อยๆ การเข้าใจพฤติกรรมลูกค้าและสร้างประสบการณ์ที่เป็นส่วนตัวเป็นกุญแจสำคัญสู่ความสำเร็จ 🔑 เรารวบรวม 30 Prompt ที่จะช่วยคุณใช้ AI วิเคราะห์พฤติกรรมลูกค้าแบบ Real-time และสร้าง Personalized Marketing ที่ตรงใจ!
ท่านสามารถเลือกใช้งานAIจากค่ายไหนก็ได้ครับ
| คุณสมบัติ | ChatGPT | Microsoft Copilot | Claude | Gemini | Perplexity |
|---|---|---|---|---|---|
| ผู้พัฒนา | OpenAI | Microsoft | Anthropic | Perplexity AI | |
| โมเดลพื้นฐาน | GPT-3.5/GPT-4 | GPT-4 | Claude | PaLM 2/Gemini | GPT-3.5/GPT-4 |
| การรองรับภาษา | หลายภาษา | หลายภาษา | หลายภาษา | หลายภาษา | หลายภาษา |
| ความสามารถในการประมวลผลภาพ | มี (GPT-4) | มี | มี | มี | มี |
| การเข้าถึงข้อมูลเรียลไทม์ | ไม่มี | มี | ไม่มี | มี | มี |
| ความสามารถในการเขียนโค้ด | ดี | ดีมาก | ดีมาก | ดี | ดี |
| การใช้งานฟรี | มีแบบจำกัด | มี | มีแบบจำกัด | มี | มี |
| แพลตฟอร์มที่รองรับ | เว็บ, มือถือ | Windows, Edge | เว็บ, API | เว็บ, มือถือ, API | เว็บ, มือถือ |
| ความสามารถในการสร้างเนื้อหา | ดีมาก | ดีมาก | ดีมาก | ดีมาก | ดี |
| การอ้างอิงแหล่งข้อมูล | ไม่มี | มี | ไม่มี | มี | มี |
ใช้งานChatGPT https://chatgpt.com/
ใช้งาน microsoft Copilot https://copilot.microsoft.com/
ใช้งาน Gemini https://gemini.google.com/app
ใช้งาน perplexity https://www.perplexity.ai/


30 Prompt สุดพาวเวอร์สำหรับการวิเคราะห์ลูกค้าและการตลาดแบบส่วนตัว
- “วิเคราะห์ข้อมูลการคลิกและเวลาที่ใช้บนหน้าเว็บไซต์ของเราในช่วง 24 ชั่วโมงที่ผ่านมา และระบุ 5 หน้าที่ได้รับความสนใจมากที่สุด พร้อมเสนอแนะวิธีปรับปรุงประสบการณ์ผู้ใช้”
- “จากข้อมูลการค้นหาบนเว็บไซต์ของเราในสัปดาห์นี้ ระบุ 10 คีย์เวิร์ดยอดนิยม และเสนอแนะวิธีการปรับปรุงเนื้อหาเพื่อตอบสนองความต้องการของผู้ใช้”
- “วิเคราะห์พฤติกรรมการเลือกซื้อสินค้าในตะกร้าของลูกค้าในช่วง 7 วันที่ผ่านมา และเสนอแนะ 5 กลยุทธ์การ Cross-selling ที่มีโอกาสประสบความสำเร็จสูง”
- “จากข้อมูลการรีวิวสินค้าในเดือนนี้ ระบุ 3 ปัญหาหลักที่ลูกค้าพบบ่อย และเสนอแนวทางการแก้ไขพร้อมแผนการสื่อสารกับลูกค้า”
- “วิเคราะห์เส้นทางการซื้อสินค้า (Customer Journey) ที่นำไปสู่การซื้อมากที่สุดในไตรมาสนี้ และเสนอแนะวิธีการปรับปรุงจุดสัมผัส (Touchpoints) ที่สำคัญ”
- “จากข้อมูลการใช้คูปองส่วนลดในแคมเปญล่าสุด วิเคราะห์ประสิทธิภาพและเสนอแนะ 3 รูปแบบคูปองใหม่ที่น่าจะได้ผลดีกว่าสำหรับแคมเปญถัดไป”
- “วิเคราะห์พฤติกรรมการใช้แอปพลิเคชันมือถือของเราในช่วงเวลาต่างๆ ของวัน และเสนอแนะช่วงเวลาที่เหมาะสมที่สุดในการส่งการแจ้งเตือน (Push Notification) สำหรับโปรโมชันใหม่”
- “จากข้อมูลการยกเลิกการสมัครรับจดหมายข่าว (Newsletter) ในเดือนนี้ วิเคราะห์สาเหตุหลักและเสนอแนะ 5 วิธีในการปรับปรุงเนื้อหาและความถี่ในการส่ง”
- “วิเคราะห์การมีส่วนร่วมของผู้ใช้ (User Engagement) บนโซเชียลมีเดียของเราในสัปดาห์นี้ และเสนอแนะ 3 ประเภทเนื้อหาที่ควรสร้างเพิ่มเติมเพื่อเพิ่มการมีส่วนร่วม”
- “จากข้อมูลการเข้าชมบล็อกของเราในเดือนนี้ ระบุ 5 หัวข้อที่ได้รับความสนใจมากที่สุด และเสนอแนะหัวข้อใหม่ๆ ที่น่าจะได้รับความสนใจในอนาคต”
- “วิเคราะห์อัตราการเปิดอีเมล (Open Rate) และอัตราการคลิก (Click-through Rate) ของแคมเปญอีเมลมาร์เก็ตติ้งล่าสุด และเสนอแนะ 3 วิธีในการปรับปรุงประสิทธิภาพ”
- “จากข้อมูลการใช้ฟีเจอร์ใหม่บนแพลตฟอร์มของเราในเดือนแรก วิเคราะห์การตอบรับของผู้ใช้และเสนอแนะการปรับปรุงหรือฟีเจอร์เพิ่มเติมที่ควรพัฒนา”
- “วิเคราะห์พฤติกรรมการใช้จ่ายของลูกค้าที่ซื้อซ้ำในไตรมาสนี้ และสร้างโปรไฟล์ลูกค้า 3 กลุ่มหลักพร้อมเสนอแนะกลยุทธ์การรักษาลูกค้าสำหรับแต่ละกลุ่ม”
- “จากข้อมูลการสอบถามของลูกค้าผ่านช่องทาง Live Chat ในสัปดาห์นี้ ระบุ 5 คำถามที่พบบ่อยที่สุดและเสนอแนะวิธีการปรับปรุง FAQ บนเว็บไซต์”
- “วิเคราะห์เวลาเฉลี่ยที่ลูกค้าใช้ในการตัดสินใจซื้อสินค้าแต่ละประเภทและเสนอแนะวิธีการเร่งกระบวนการตัดสินใจโดยไม่สร้างความกดดันมากเกินไป”

ผมได้ไปเจอคลิปนี้ มีการแจกระบบเทรดของลุงโฉลก ซึ่งเป็น CDC ActionZone ก็เลยเอาไปปรับแต่งเพิ่มนิดๆหน่อยๆ ให้ทำการเปิดสัญญาณซื้อขาย กับเพิ่มสัญลักษณ์การใช้งานให้ง่ายขึ้น

1.เปิดบัญชีทดลอง
ทดลองเทรด Binaryoption (เหมาะก็ต่อเมื่อเปิดดูสัญญาณ TF 1H ขึ้นไป) ฝึกฝนเทรดฟรีคลิกที่นี่
ทดลองเทรดForex (ใช้ได้ดีกับสัญญาณนี้) ฝึกฝนเทรดฟรีคลิกที่นี่
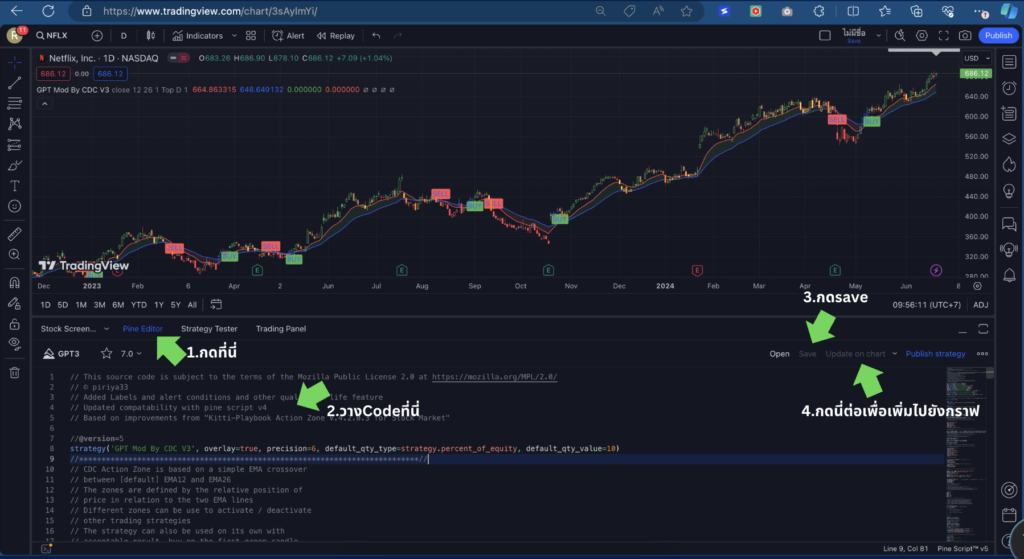
2.ไปที่ https://www.tradingview.com/ แล้วเอาCodeที่ผมแจก ก็อปวางได้เลยครับ
// This source code is subject to the terms of the Mozilla Public License 2.0 at https://mozilla.org/MPL/2.0/
// © piriya33
// Added Labels and alert conditions and other quality of life feature
// Updated compatability with pine script v4
// Based on improvements from "Kitti-Playbook Action Zone V.4.2.0.3 for Stock Market"

//@version=5
strategy('GPT Mod By CDC V3', overlay=true, precision=6, default_qty_type=strategy.percent_of_equity, default_qty_value=10)
//****************************************************************************//
// CDC Action Zone is based on a simple EMA crossover
// between [default] EMA12 and EMA26
// The zones are defined by the relative position of
// price in relation to the two EMA lines
// Different zones can be use to activate / deactivate
// other trading strategies
// The strategy can also be used on its own with
// acceptable result, buy on the first green candle
// and sell on the first red candle
//****************************************************************************//
//****************************************************************************//
// Define User Input Variables

xsrc = input.source(title='Source Data', defval=close)
xprd1 = input.int(title='Fast EMA period', defval=12)
xprd2 = input.int(title='Slow EMA period', defval=26)
xsmooth = input.int(title='Smoothing period (1 = no smoothing)', defval=1)
fillSW = input.bool(title='Paint Bar Colors', defval=true)
fastSW = input.bool(title='Show fast moving average line', defval=true)
slowSW = input.bool(title='Show slow moving average line', defval=true)
labelSwitch = input.bool(title='Turn on assistive text', defval=true)
plotSigsw = input.bool(title='Plot Buy/Sell Signals? ', defval=true)
plotRibsw = input.bool(title='Plot Buy/Sell Ribbon', defval=false)
plotRibbonPos = input.string(title='Ribbon Position', options=['Top', 'Bottom'], defval='Top')

xfixtf = input.bool(title='** Use Fixed time frame Mode (advanced) **', defval=false)
xtf = input.timeframe(title='** Fix chart to which time frame ? **)', defval='D')

plotSig2sw = input.bool(title='Plot momentum based Buy/Sell Signals? ', defval=false)
plotSig2lv = input.int(title='Set signal threshold (higher = stricter)', defval=1, minval=0, maxval=1)

//****************************************************************************//
//Calculate Indicators

f_secureSecurity(_symbol, _res, _src) => request.security(_symbol, _res, _src[1], lookahead = barmerge.lookahead_on) // Using f_secureSecurity to avoid repainting

xPrice = ta.ema(xsrc, xsmooth)


FastMA = xfixtf ?
 ta.ema(f_secureSecurity(syminfo.tickerid, xtf, ta.ema(xsrc, xprd1)), xsmooth)
 :
 ta.ema(xPrice, xprd1)


SlowMA = xfixtf ?
 ta.ema(f_secureSecurity(syminfo.tickerid, xtf, ta.ema(xsrc, xprd2)), xsmooth)
 :
 ta.ema(xPrice, xprd2)

Bull = FastMA > SlowMA
Bear = FastMA < SlowMA

//****************************************************************************//
// Define Color Zones

Green = Bull and xPrice > FastMA  // Buy
Blue = Bear and xPrice > FastMA and xPrice > SlowMA  //Pre Buy 2
LBlue = Bear and xPrice > FastMA and xPrice < SlowMA  //Pre Buy 1

Red = Bear and xPrice < FastMA  // Sell
Orange = Bull and xPrice < FastMA and xPrice < SlowMA  // Pre Sell 2
Yellow = Bull and xPrice < FastMA and xPrice > SlowMA  // Pre Sell 1

//****************************************************************************//
// Display color on chart


bColor = Green ? color.green :
 Blue ? color.blue :
 LBlue ? color.aqua :
 Red ? color.red :
 Orange ? color.orange :
 Yellow ? color.yellow :
 color.black
barcolor(color=fillSW ? bColor : na)

//****************************************************************************//
// Display MA lines

FastL = plot(fastSW ? FastMA : na, 'Fast EMA', color=color.new(color.red, 0), style = xfixtf ? plot.style_stepline : plot.style_line)
SlowL = plot(slowSW ? SlowMA : na, 'Slow EMA', color=color.new(color.blue, 0), style = xfixtf ? plot.style_stepline : plot.style_line)
fillcolor = Bull ? color.new(color.green,90) : Bear ? color.new(color.red,90) : color.new(color.black,90) // fillcolor = Bull ? color.green : Bear ? color.red : color.black
fill(FastL, SlowL, fillcolor) // fill(FastL, SlowL, fillcolor, transp=90)

//****************************************************************************//
// Define Buy and Sell condition
// This is only for thebasic usage of CDC Actionzone (EMA Crossover)
// ie. Buy on first green bar and sell on first red bar

buycond = Green and Green[1] == 0
sellcond = Red and Red[1] == 0

bullish = ta.barssince(buycond) < ta.barssince(sellcond)
bearish = ta.barssince(sellcond) < ta.barssince(buycond)

buy = bearish[1] and buycond
sell = bullish[1] and sellcond

bColor_BullBear = bullish ? color.green : bearish ? color.red : color.black

//****************************************************************************//
// Plot Buy and Sell point on chart

plotshape(plotSigsw ? buy : na,
 style=shape.labelup,
 title='Buy Signal',
 location=location.belowbar,
 color=color.new(color.green, 0),
 text="BUY")
plotshape(plotSigsw ? sell : na,
 style=shape.labeldown,
 title='Sell Signal',
 location=location.abovebar,
 color=color.new(color.red, 0),
 text="SELL")

// Display Buy/Sell Ribbon


plotshape(plotRibsw ? plotRibbonPos == 'Top' ? close : na : na,
 style=shape.square,
 title='Buy/Sell Ribbon',
 location=location.top,
 color=bColor_BullBear)

plotshape(plotRibsw ? plotRibbonPos == 'Bottom' ? close : na : na,
 style=shape.square,
 title='Buy/Sell Ribbon',
 location=location.bottom,
 color=bColor_BullBear)


//****************************************************************************//
// Label

labelstyle = close > SlowMA ? label.style_label_down : label.style_label_up
labelyloc = close > SlowMA ? yloc.abovebar : yloc.belowbar
labeltcolor = buy ? color.black :
 sell ? color.white :
 close > close[1] ? color.green :
 color.red
labelbgcolor = buy ? color.green : sell ? color.red : color.silver
labeltext = buy ? 'BUY next bar\n' : sell ? 'SELL next bar\n' : ' '
trendText = bullish ? 'bullish' : bearish ? 'bearish' : 'sideways'


l1 = label.new(bar_index, na,
 text=labeltext + syminfo.ticker + ' ' + str.tostring(close) + ' ' + syminfo.currency + '\n currently in a ' + trendText + ' trend \n',
 color=labelbgcolor,
 textcolor=labeltcolor,
 yloc=labelyloc,
 style=labelstyle)

label.delete(labelSwitch ? l1[1] : l1)

// Momentum Signal using StochRSI

// Adds a momentum based signal following trends to the script
// Default is hidden, only use with caution
// Parameters for STOCH RSI is hard-coded to avoid cluttering the input screen further
// If you need to change anything, make a copy of the code and change it.
// Inputs are commented out, to enable them comment out the hard coded variables first!

// fixed inputs //

smoothK = 3
smoothD = 3
RSIlen = 14
STOlen = 14
SRsrc = close
OSlevel = 30
OBlevel = 70

// User inputs // // COMMENT ABOVE VARIABLES FIRST!!

// smoothK = input(3,"StochRSI smooth K",type=input.integer,minval=1)
// smoothD = input(3,"StochRSI smooth D",type=input.integer,minval=1)
// RSIlen = input(14,"RSI length",type=input.integer,minval=1)
// STOlen = input(14,"Stochastic length",type=input.integer,minval=1)
// SRsrc = input(close,"Source for StochasticRSI",type=input.source)
// OSlevel = input(30,"Oversold Threshold",type=input.float,minval=0.00)
// OBlevel = input(70,"Oversold Threshold",type=input.float,minval=0.00)

// calculations //
rsi1 = ta.rsi(SRsrc, RSIlen)
k = ta.sma(ta.stoch(rsi1, rsi1, rsi1, STOlen), smoothK)
d = ta.sma(k, smoothD)

// storsiBuySig =  if bullish
//     if (d < OSlevel and crossover(k,d))
//         3
//     else if crossover(k,OSlevel)
//         2
//     else if d > OSlevel and crossover(k,d)
//         1
//     else
//         0
// else
//     0

crossover_1 = ta.crossover(k, d)
crossover_2 = ta.crossover(k, d)
iff_1 = d > OSlevel and crossover_2 ?
 1 : 0
iff_2 = d < OSlevel and crossover_1 ?
 2 : iff_1
storsiBuySig = bullish ? iff_2 : 0

crossunder_1 = ta.crossunder(k, d)
crossunder_2 = ta.crossunder(k, d)
iff_3 = d < OBlevel and crossunder_2 ?
 1 : 0
iff_4 = d > OBlevel and crossunder_1 ?
 2 : iff_3
storsiSellSig = bearish ? iff_4 : 0

plotshape(plotSig2sw ? storsiBuySig > plotSig2lv ? storsiBuySig : na : na,
 'Buy more signals', style=shape.triangleup,
  location=location.belowbar, color=color.new(color.teal, 0))
plotshape(plotSig2sw ? storsiSellSig > plotSig2lv ? storsiSellSig : na : na,
 'Sell more signals', style=shape.triangledown,
  location=location.abovebar, color=color.new(color.orange, 0))


//****************************************************************************//
// Alert conditions

alertcondition(buy,
 title='*Buy Alert',
 message='Buy {{exchange}}:{{ticker}}')

alertcondition(sell,
 title='*Sell Alert',
 message='Sell {{exchange}}:{{ticker}}')

alertcondition(bullish,
 title='is Bullish')

alertcondition(bearish,
 title='is Bearish')

alertcondition(Green,
 title='is Green')

alertcondition(Blue,
 title='is Blue (Strong Rally)')

alertcondition(LBlue,
 title='is Light Blue (Rally)')

alertcondition(Red,
 title='is Red')

alertcondition(Orange,
 title='is Orange (Strong Dip)')

alertcondition(Yellow,
 title='is Yellow (Dip)')


//****************************************************************************//

// Entry and Exit Strategy
if (buy)
    strategy.entry("Buy", strategy.long)

if (sell)
strategy.close("Buy")- “วิเคราะห์อัตราการทิ้งตะกร้าสินค้า (Cart Abandonment Rate) ในเดือนนี้ ระบุ 3 สาเหตุหลัก และเสนอแนะกลยุทธ์การ Retargeting ที่มีประสิทธิภาพ”
- “จากข้อมูลการใช้ฟิลเตอร์ค้นหาสินค้าบนเว็บไซต์ในสัปดาห์นี้ ระบุ 5 คุณสมบัติสินค้าที่ลูกค้าให้ความสำคัญมากที่สุด และเสนอแนะวิธีการปรับปรุงการแสดงข้อมูลสินค้า”
- “วิเคราะห์พฤติกรรมการใช้งานของลูกค้าที่สมัครทดลองใช้บริการฟรีในเดือนนี้ และเสนอแนะ 3 กลยุทธ์เพื่อเพิ่มอัตราการเปลี่ยนเป็นลูกค้าที่ชำระเงิน”
- “จากข้อมูลการแชร์คอนเทนต์ของเราบนโซเชียลมีเดียในไตรมาสนี้ วิเคราะห์ลักษณะของคอนเทนต์ที่ได้รับการแชร์มากที่สุด และเสนอแนะ 5 ไอเดียคอนเทนต์ใหม่ที่มีโอกาสไวรัล”
- “วิเคราะห์ช่วงเวลาที่ลูกค้ามักจะทำการซื้อซ้ำ (Repurchase Cycle) สำหรับสินค้าแต่ละประเภท และเสนอแนะแผนการส่งข้อความแจ้งเตือนหรือโปรโมชันที่เหมาะสม”
- “จากข้อมูลการใช้ระบบแนะนำสินค้า (Recommendation Engine) บนเว็บไซต์ในเดือนนี้ วิเคราะห์ประสิทธิภาพและเสนอแนะ 3 วิธีในการปรับปรุงอัลกอริทึมเพื่อเพิ่มยอดขาย”
- “วิเคราะห์พฤติกรรมการใช้งานของลูกค้าที่เข้ามาผ่านแคมเปญโฆษณาออนไลน์ล่าสุด เปรียบเทียบกับลูกค้าที่มาจากช่องทางอื่น และเสนอแนะวิธีการปรับปรุงแคมเปญในอนาคต”
- “จากข้อมูลการใช้ฟีเจอร์การเปรียบเทียบสินค้าบนเว็บไซต์ในสัปดาห์นี้ ระบุ 5 คุณสมบัติที่ลูกค้าใช้เปรียบเทียบมากที่สุด และเสนอแนะวิธีการนำเสนอข้อมูลเปรียบเทียบที่มีประสิทธิภาพมากขึ้น”
- “วิเคราะห์ความสัมพันธ์ระหว่างการให้คะแนนความพึงพอใจของลูกค้าและมูลค่าการซื้อซ้ำในไตรมาสนี้ และเสนอแนะ 3 กลยุทธ์เพื่อเพิ่มทั้งความพึงพอใจและยอดขาย”
- “จากข้อมูลการใช้คุณสมบัติการค้นหาด้วยเสียง (Voice Search) บนแอปพลิเคชันในเดือนนี้ วิเคราะห์รูปแบบคำค้นหาที่ใช้บ่อย และเสนอแนะวิธีการปรับปรุงระบบค้นหาให้ตอบสนองได้ดียิ่งขึ้น”
- “วิเคราะห์ความสัมพันธ์ระหว่างความเร็วในการโหลดหน้าเว็บไซต์และอัตราการคอนเวอร์ชัน (Conversion Rate) ในสัปดาห์นี้ และเสนอแนะ 3 วิธีในการปรับปรุงประสิทธิภาพของเว็บไซต์”
- “จากข้อมูลการใช้ระบบ Chatbot ในการให้บริการลูกค้าในเดือนนี้ วิเคราะห์ประสิทธิภาพในการแก้ปัญหาและเสนอแนะ 5 วิธีในการปรับปรุงความสามารถของ Chatbot”
- “วิเคราะห์พฤติกรรมการใช้งานของลูกค้าที่เข้ามาผ่านลิงก์ใน Influencer Marketing แคมเปญล่าสุด และเสนอแนะ 3 แนวทางในการปรับปรุงการทำงานร่วมกับ Influencer ในอนาคต”
- “จากข้อมูลการใช้ฟีเจอร์ Wishlist บนเว็บไซต์ในไตรมาสนี้ วิเคราะห์ประเภทสินค้าที่ถูกเพิ่มบ่อยที่สุดและเสนอแนะกลยุทธ์การตลาดเพื่อกระตุ้นการซื้อจาก Wishlist”
- “วิเคราะห์ความสัมพันธ์ระหว่างการอ่านรีวิวสินค้าและการตัดสินใจซื้อในเดือนนี้ และเสนอแนะ 3 วิธีในการส่งเสริมให้ลูกค้าเขียนรีวิวที่มีคุณภาพมากขึ้น”

AI Master Class
(ใช้AIช่วยทำธุรกิจ การตลาด เพิ่มประสิทธิภาพ)


ขอขอบคุณที่ไว้วางใจ


เราอยู่ในยุคที่ AI กำลังจะมาพลิกโลกการทำงาน


คอร์สนี้เหมาะสำหรับ
![]() ผู้ประกอบการ เจ้าของธุรกิจ ที่อยากนำ AI มาช่วยเพิ่มผลกำไร เพิ่มยอดขาย
ผู้ประกอบการ เจ้าของธุรกิจ ที่อยากนำ AI มาช่วยเพิ่มผลกำไร เพิ่มยอดขาย![]() มนุษย์เงินเดือน ที่ต้องการอัพสกิลตัวเอง เพื่อเพิ่มโอกาสในอาชีพการงาน
มนุษย์เงินเดือน ที่ต้องการอัพสกิลตัวเอง เพื่อเพิ่มโอกาสในอาชีพการงาน![]() ผู้ที่สนใจเทคโนโลยี AI และต้องการนำไปประยุกต์ใช้ในชีวิตประจำวัน
ผู้ที่สนใจเทคโนโลยี AI และต้องการนำไปประยุกต์ใช้ในชีวิตประจำวัน![]() นักลงทุน ที่ต้องการให้ AI ช่วยตัดสินใจในการลงทุน
นักลงทุน ที่ต้องการให้ AI ช่วยตัดสินใจในการลงทุน
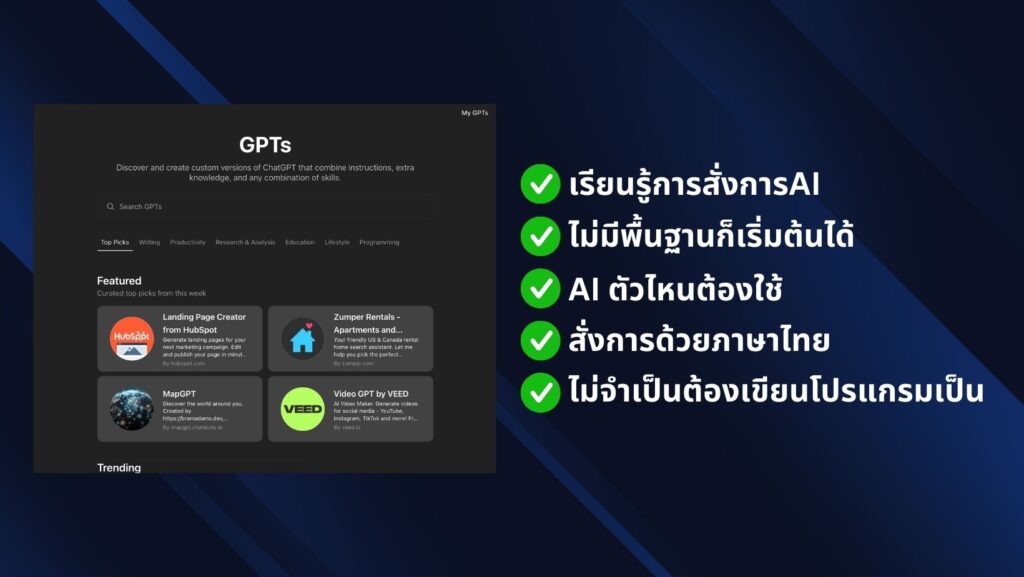
สิ่งที่คุณจะได้เรียนรู้ในคอร์ส
![]() ปูพื้นฐาน AI และ ChatGPT จากระดับเริ่มต้นจนใช้งานเป็น
ปูพื้นฐาน AI และ ChatGPT จากระดับเริ่มต้นจนใช้งานเป็น![]() เทคนิคการ Prompt ให้ AI ทำงานตามที่เราต้องการ
เทคนิคการ Prompt ให้ AI ทำงานตามที่เราต้องการ![]() ประยุกต์ใช้ AI ในด้านต่างๆ เช่น การตลาด, Content Creation, SEO
ประยุกต์ใช้ AI ในด้านต่างๆ เช่น การตลาด, Content Creation, SEO![]() สร้างรูปภาพ วิดีโอ ด้วย AI อย่าง DALL-E
สร้างรูปภาพ วิดีโอ ด้วย AI อย่าง DALL-E![]() เรียนรู้การใช้ AI ช่วยเหลือในการลงทุน
เรียนรู้การใช้ AI ช่วยเหลือในการลงทุน![]() AI อีกมากมายที่จะช่วยให้ชีวิดและธุรกิจของคุณง่ายขึ้น
AI อีกมากมายที่จะช่วยให้ชีวิดและธุรกิจของคุณง่ายขึ้น
🔥 สุดยอดความคุ้มของคอร์ส 🔥
✅ เรียน AI คุ้มที่สุด! 🎯 ได้คอร์สออนไลน์ที่อัปเดต ฟรีตลอดชีพ (ตอนนี้มี 100+ บทเรียนแล้ว!)
✅ Workshop จับมือทำ 1 ครั้ง 👨🏫 ใช้ AI เป็นแน่นอน! ทำจริง พร้อมโค้ชดูแลใกล้ชิด
✅ กลุ่มเล็ก สอนละเอียด! 👥 จำกัดแค่ 8 คนต่อรอบ ได้รับคำแนะนำแบบตัวต่อตัว
✅ AI ใช้งานได้จริง! 🚀 ทำคอนเทนต์ไวขึ้น / ทำ SEO / สร้างภาพ-วิดีโอ / เพิ่มประสิทธิภาพธุรกิจ
✅ สมัครครั้งเดียว คุ้มตลอดชีพ! 💰 ไม่มีรายเดือน อัปเดตเนื้อหาใหม่ฟรี!


และยังมีการประยุกต์ใช้อื่นๆอีกมากมาย
![]() ใช้ Gemini วางแผนการเรียน พร้อมตัวอย่างการใช้งาน
ใช้ Gemini วางแผนการเรียน พร้อมตัวอย่างการใช้งาน
📝 Workshop เพจสอนพิเศษคณิตศาสตร์
💬 workshop เพจ ธุรกิจสอนภาษาอังกฤษ
📝 ลองให้ ChatGPT สอนเขียน HTML CSS สอนดีไม่พอสรุปได้ดีด้วย
🚀 สอนสร้างหน้าเวปใน5นาที ด้วย ChatGPT ไม่ต้องเขียนCodeเองแม้แต่ตัวเดียว
🎥 AI สรุปคลิป youtube
💡 ใช้ ChatGPT ออกไอเดียทำคลิปวีดีโอ
🗺️ ChatGPT เขียน Mind Mapping ได้ด้วย
🔍 ใช้ Chat GPT ช่วยหารูปได้ด้วย
📚 ล้ำจัด ให้ AI แต่งนิทาน พร้อมภาพประกอบ คอมโบ ChatGPT+Midjourney+Canva
🖌️ ทำรูปสมุดระบายสี ด้วย Midjourney
📈 ใช้ ChatGPT เขียน SEO ตั้งแต่เริ่ม
📊 50 marketing Prompt
🖼️ สร้างรูปฟรีๆผ่าน ChatGPT
🖥️ ใช้ ChatGPT สร้างslide แบบ powerpoint
📺 สร้างคำอธิบายคลิป Youtube เพิ่ม SEO
ไอเดียทำคลิปไม่มีตัน
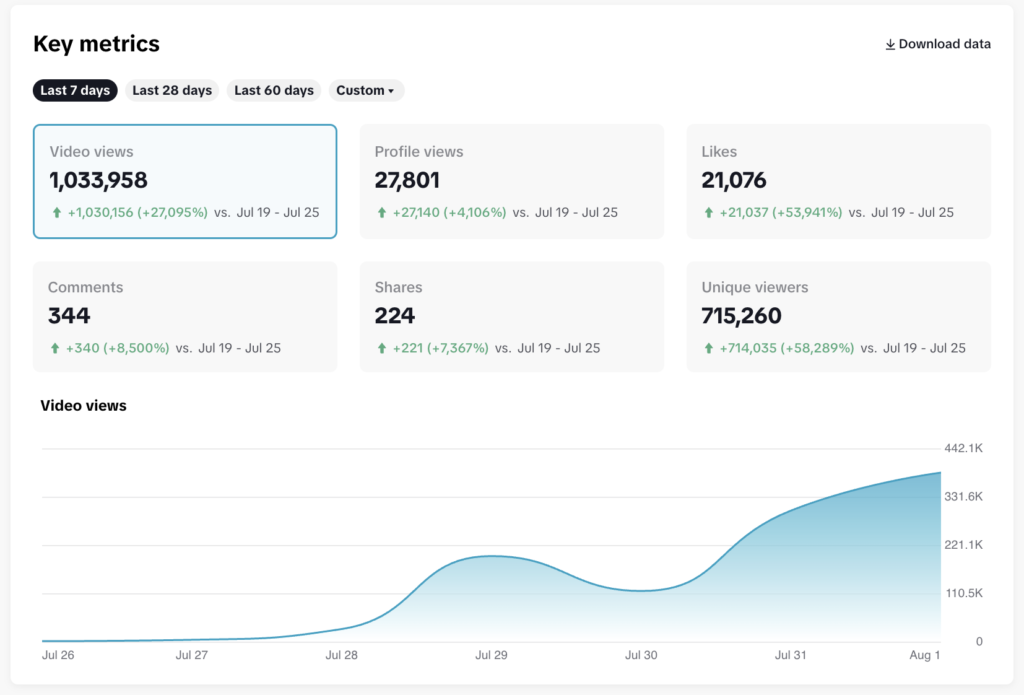
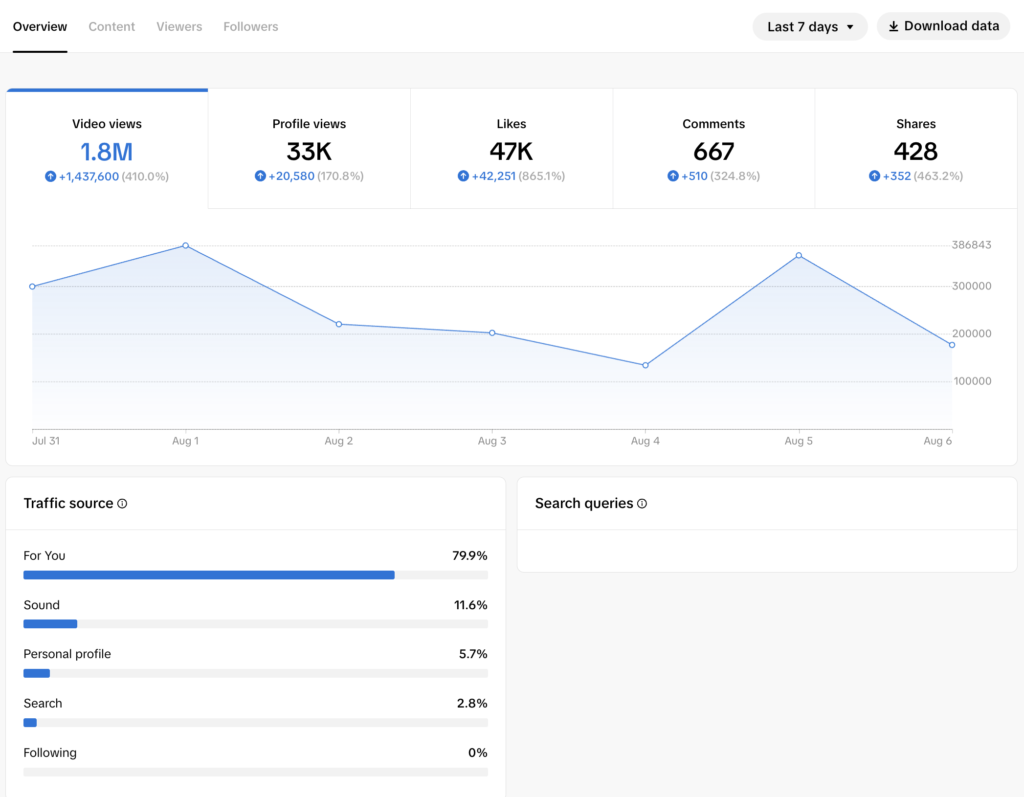
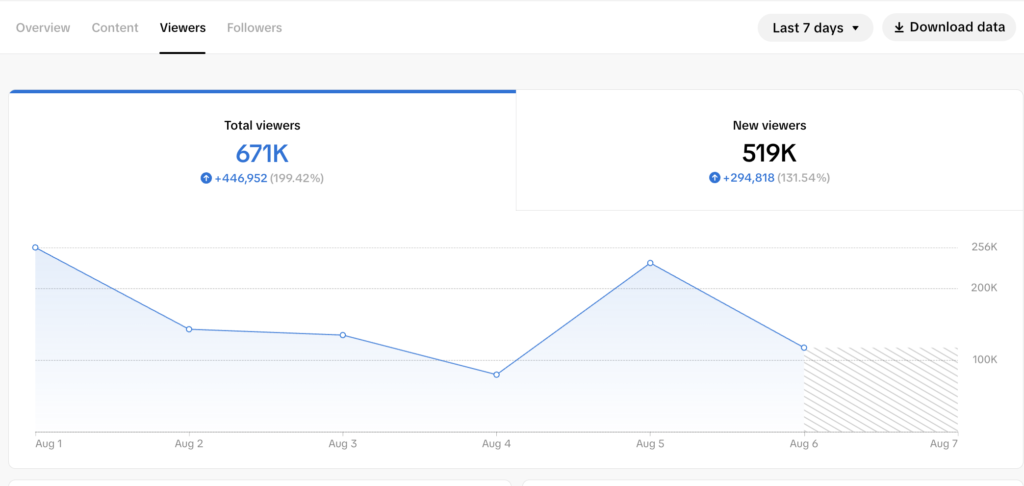
ช่วยเราทำคลิป tiktok ยอดวิวพุ่งๆ ไม่ต้องยิงAds